Morning edition · Friday, 23 October 2026
Kaub climbed back over the 2018 line
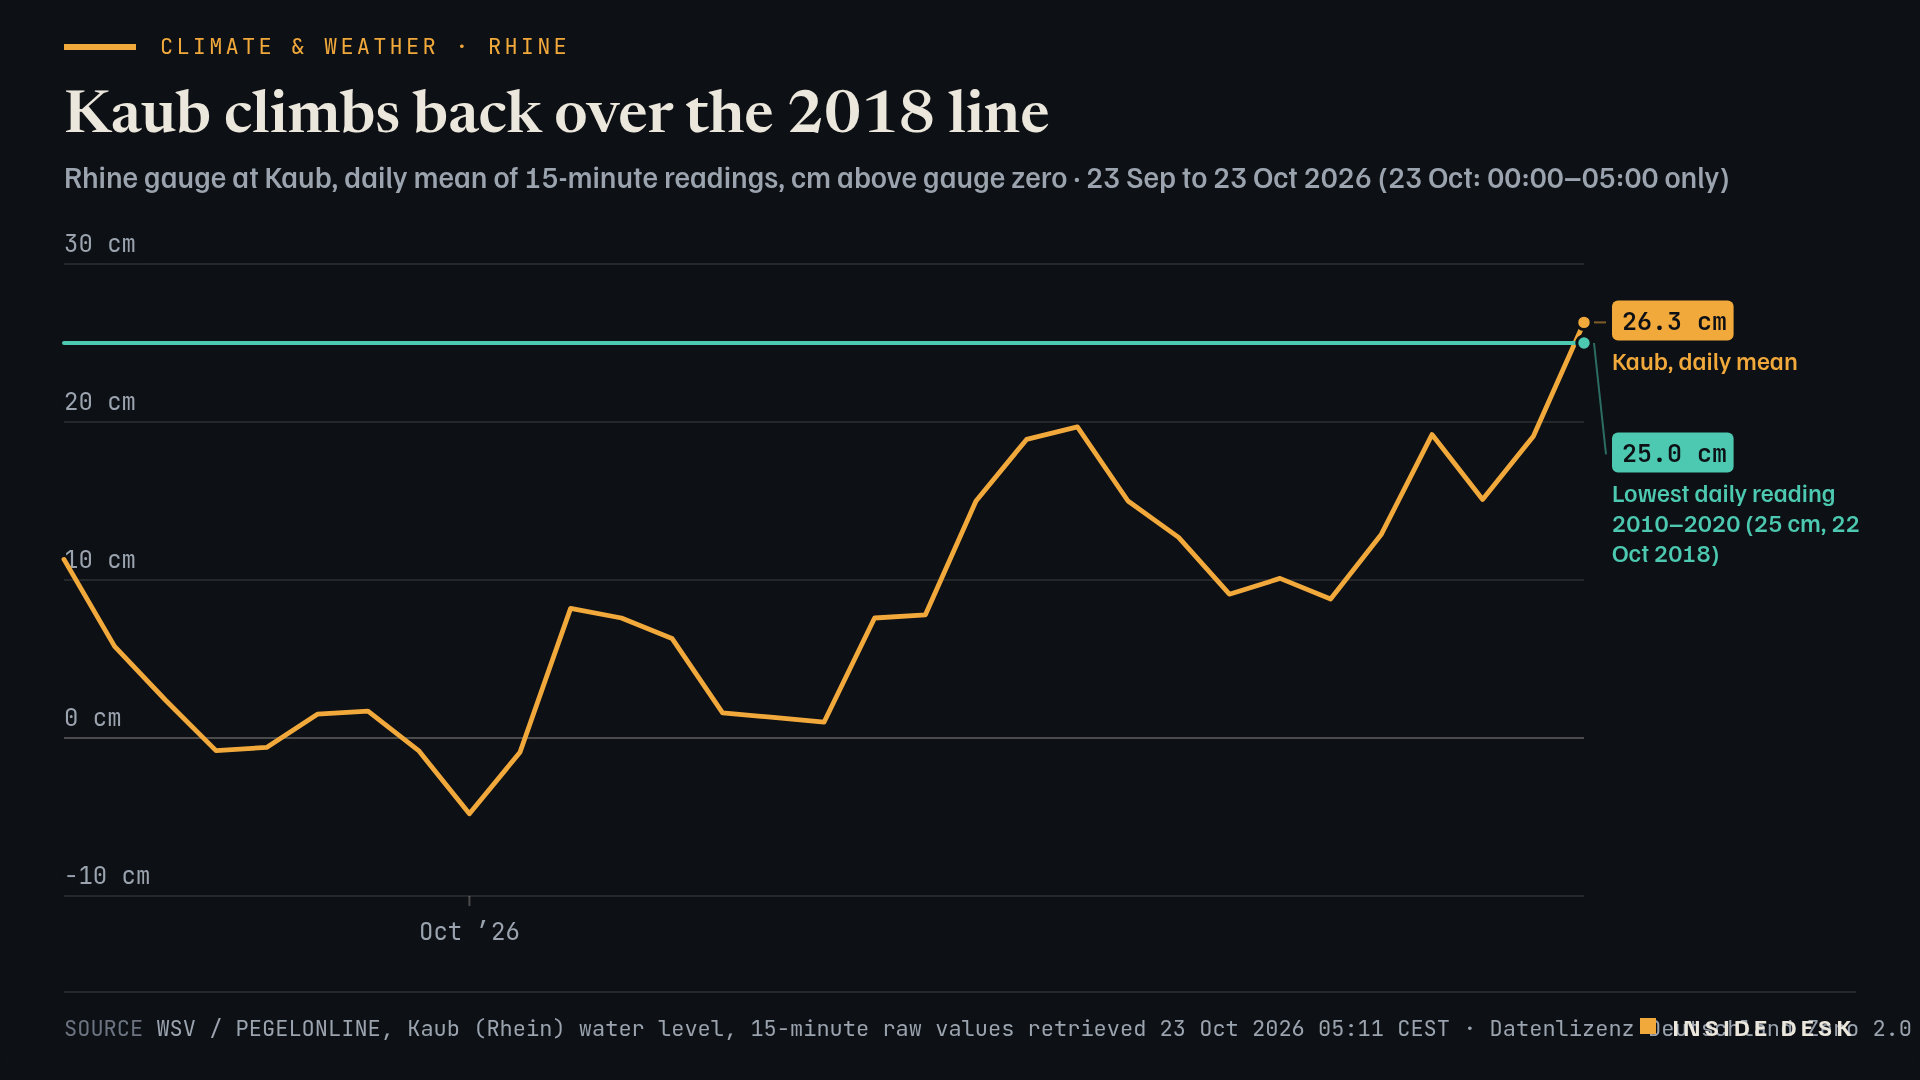
For a month every daily mean at the Rhine's bottleneck sat below the low of its reference decade. At 23:45 on Thursday the gauge read 26 cm. By 05:00 it read 28.
Yesterday this desk reported that the Rhine gauge at Kaub had spent a month below 25 cm, the lowest daily reading of its 2010–2020 reference period, set on 22 October 20182. Overnight the line was crossed. At 23:45 on Thursday the gauge read 26 cm, its first reading at or above 25 cm in the 32 days of data the federal waterways administration publishes1. At 05:00 on Friday it read 28 cm1.
Line chart of the Rhine water level at the Kaub gauge from 23 September to 23 October 2026, as daily means of 15-minute readings in centimetres above the gauge zero, against a flat line at 25 cm, the lowest daily reading of the 2010–2020 reference period, set on 22 October 2018. Thirty daily means, 23 September to 22 October, sit below that line, five of them below zero, with the lowest at −4.8 cm on 1 October. The level recovers to 19.7 cm on 13 October, dips to 8.8 cm on 18 October and reaches 19.1 cm on 22 October. The last point, 23 October, covers only midnight to 05:00 and averages 26.3 cm, the first point above the line, with a last reading of 28 cm at 05:00.
Source WSV / PEGELONLINE, Kaub (Rhein) water level, 15-minute raw values retrieved 23 Oct 2026 05:11 CEST · Datenlizenz Deutschland Zero 2.0 · daily means: desk arithmetic. Wasserstraßen- und Schifffahrtsverwaltung des Bundes (WSV), PEGELONLINE. Datenlizenz Deutschland – Zero – Version 2.0.
Data (CSV) · SVG · PNG

Latest values as a table
| Date | Kaub, daily mean | Lowest daily reading 2010–2020 (25 cm, 22 Oct 2018) |
|---|---|---|
| 2026-10-18 | 8.8 | 25 |
| 2026-10-19 | 12.9 | 25 |
| 2026-10-20 | 19.2 | 25 |
| 2026-10-21 | 15.1 | 25 |
| 2026-10-22 | 19.1 | 25 |
| 2026-10-23 | 26.3 | 25 |
The arithmetic. Desk arithmetic on the 15-minute readings: Thursday’s full daily mean came to 19.1 cm, still below the 2018 line, as every daily mean since at least 22 September has been1. Friday’s mean from midnight to 05:00 is 26.3 cm1. That is five hours, not a day, and the readings are raw data that can still be revised1. Discharge at Kaub was 555 cubic metres a second at 04:45, against 509 at 16:00 on Thursday2.
Upstream. The rise is not a local blip. At Mainz the gauge read 106 cm at 05:15 on Wednesday and 125 cm at 05:00 on Friday; at Maxau, near Karlsruhe, 295 cm and 306 cm3. Water at Kaub is water that passed those gauges first.
What it is not. 28 cm is still 180 cm below Kaub’s long-run mean of 208 cm, and 49 cm short of the 77 cm equivalent water level at which the shipping channel is guaranteed to be 1.90 m deep2. Desk arithmetic. Barges still load light. A low that has stopped getting worse is not the same as a river that works.
The constructive reading. The turn was visible to anyone at 23:45, the moment it happened, on a free public feed1. Shippers do not need a press release to know when to load an extra few hundred tonnes; they need the next quarter-hour. That is what the gauge gives them, and this morning it gave them a better number than any of the last thirty days.
What to watch
A river is not saved by one night. It is measured by one, and that is a start.
Sources
- PEGELONLINE REST API: Kaub (Rhein), water level W, 15-minute raw values for the last 32 days — Wasserstraßen- und Schifffahrtsverwaltung des Bundes (WSV), retrieved 23 Oct 2026, 05:11 CEST.
- PEGELONLINE REST API: Kaub station, current values and characteristic values (NW, MW, TuGLW) — WSV, retrieved 23 Oct 2026, 05:11 CEST.
- PEGELONLINE REST API: Mainz and Maxau (Rhein), water level W, 15-minute raw values for the last 2 days — WSV, retrieved 23 Oct 2026, 05:11 CEST.
Every figure in this piece traces to a source above or to the desk’s own arithmetic on those sources, marked as such. Quotations are short and attributed. Spot an error? Write to the desk; corrections are logged on the method page.
Commentary for information only. Not investment, legal, tax, medical or political advice. Not an offer or solicitation. Analysis may be incomplete or wrong. Charts show published public data, not a trading feed; binding numbers live with the institutions that publish them.