Evening edition · Thursday, 22 October 2026
Kaub spent a month below the 2018 low
Eight years ago today the Rhine at Kaub set the low of its reference decade, 25 cm. Every daily mean of the past 31 days has been below it. The storms are coming to the west, not to the Rhine.
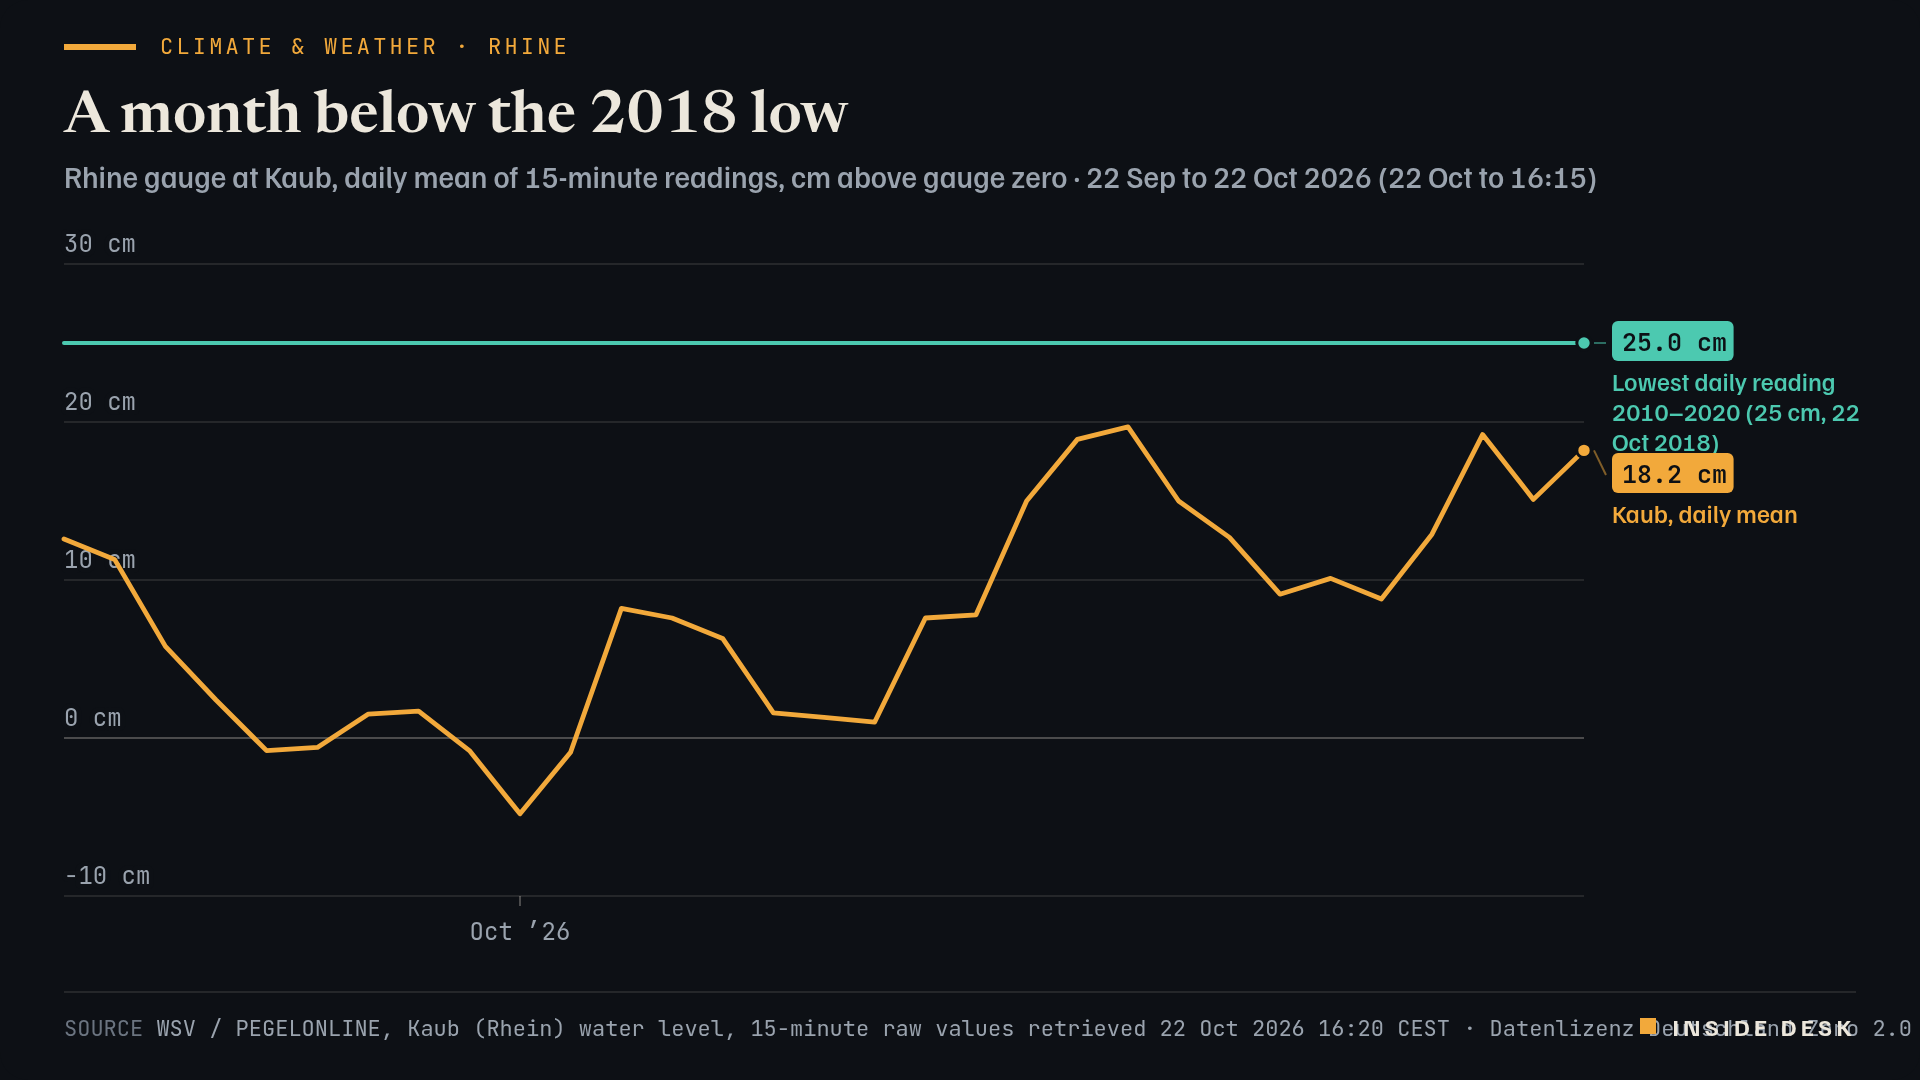
The lowest daily water level the Rhine gauge at Kaub recorded in its 2010–2020 reference period was 25 cm, on 22 October 20182. That was eight years ago today. At 16:15 this afternoon the gauge read 17 cm1,2.
Line chart of the Rhine water level at the Kaub gauge from 22 September to 22 October 2026, as daily means of 15-minute readings in centimetres above the gauge zero, against a flat line at 25 cm, the lowest daily reading of the 2010–2020 reference period, set on 22 October 2018. All 31 daily means sit below that line. The level falls from 12.6 cm on 22 September to below zero on five days, with a daily mean of −4.8 cm on 1 October and a lowest reading of −6 cm that morning, recovers to 19.7 cm on 13 October, dips to 8.8 cm on 18 October and stands at 18.2 cm on 22 October, to 16:15, with a last reading of 17 cm.
Source WSV / PEGELONLINE, Kaub (Rhein) water level, 15-minute raw values retrieved 22 Oct 2026 16:20 CEST · Datenlizenz Deutschland Zero 2.0 · daily means: desk arithmetic. Wasserstraßen- und Schifffahrtsverwaltung des Bundes (WSV), PEGELONLINE. Datenlizenz Deutschland – Zero – Version 2.0.
Data (CSV) · SVG · PNG

Latest values as a table
| Date | Kaub, daily mean | Lowest daily reading 2010–2020 (25 cm, 22 Oct 2018) |
|---|---|---|
| 2026-10-17 | 10.1 | 25 |
| 2026-10-18 | 8.8 | 25 |
| 2026-10-19 | 12.9 | 25 |
| 2026-10-20 | 19.2 | 25 |
| 2026-10-21 | 15.1 | 25 |
| 2026-10-22 | 18.2 | 25 |
The month. The federal waterways administration publishes the gauge every 15 minutes1. Desk arithmetic on those readings: all 31 daily means from 22 September to 22 October sat below 25 cm. Five were below zero, the lowest a mean of −4.8 cm on 1 October, when the gauge touched −6 cm in the early morning1. The best day was 13 October, at 19.7 cm1. Thursday’s mean so far is 18.2 cm1. The administration flags the readings as raw data, so they can still be revised1.
What the number is. A gauge reading is not the depth of the river. It is measured from a fixed zero, 67.669 m above sea level at Kaub2. The shipping channel is guaranteed to be 1.90 m deep when the gauge reads 77 cm, the “equivalent water level”2. Desk arithmetic: today’s 17 cm is 60 cm short of that reference. Barges load lighter, and more of them are needed for the same tonnage.
The weather. Storm Austen is bringing heavy rain this week, but to Brittany and Normandy, and the winds then shift towards northern France3. That is not the Rhine’s catchment. A river at Kaub is fed by Switzerland, the Black Forest, the Main and the Neckar, and it answers to their rain, not the Channel’s.
The constructive reading. Nothing about this month was hidden. Every reading was public, every quarter of an hour, free to use. Shippers, power stations and chemical plants along the river plan on exactly this data. A low that arrives slowly is one that logistics can price and route around, and the published numbers are what make that possible.
What to watch
A record broken slowly makes no noise. It is still a record.
Sources
- PEGELONLINE REST API: Kaub (Rhein), water level W, 15-minute raw values for the last 31 days — Wasserstraßen- und Schifffahrtsverwaltung des Bundes (WSV), retrieved 22 Oct 2026, 16:20 CEST.
- PEGELONLINE REST API: Kaub station, current values and characteristic values (NW, MW, GlW, TuGLW) — WSV, retrieved 22 Oct 2026, 16:20 CEST.
- Tempête Austen : vents violents ce vendredi sur le nord-ouest du pays — Météo-France, 22 Oct 2026.
Every figure in this piece traces to a source above or to the desk’s own arithmetic on those sources, marked as such. Quotations are short and attributed. Spot an error? Write to the desk; corrections are logged on the method page.
Commentary for information only. Not investment, legal, tax, medical or political advice. Not an offer or solicitation. Analysis may be incomplete or wrong. Charts show published public data, not a trading feed; binding numbers live with the institutions that publish them.