Event
A reference forecast is a hope with a footnote
The IMF did not publish a baseline in April. It published a reference case and said, in plain print, that the world was drifting away from it. Read the footnote first.
April began with the year’s highest print and a ceasefire. On the EIA spot series Brent reached $138.21 on 7 April, the day the United States and Iran agreed a two-week ceasefire6, and fell to $122.11 the next day4. A week later, on 14 April, the IMF published its spring World Economic Outlook under the title Global Economy in the Shadow of War1.
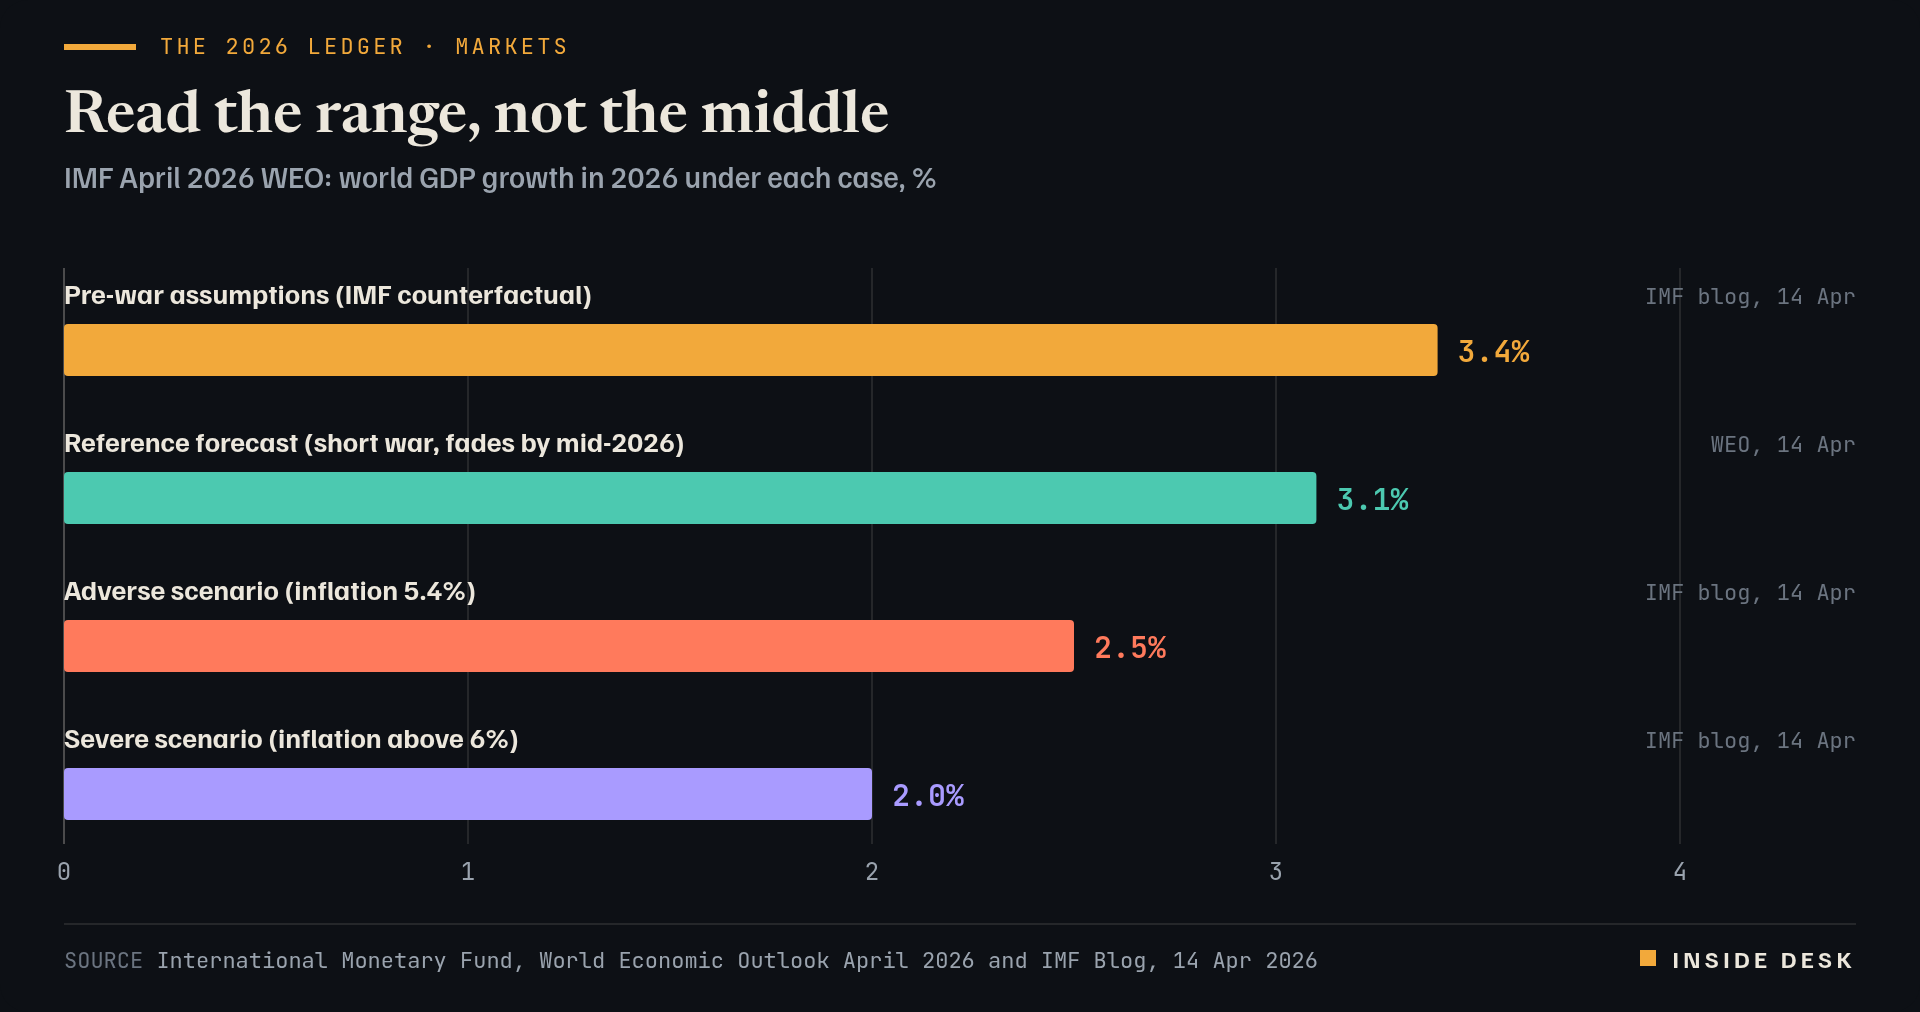
The honest part was the format. The Fund did not call its central number a baseline. It called it a “reference forecast”, predicated on a war of “limited duration, intensity, and scope, such that the disruptions will fade by mid-2026”, consistent with futures prices as of 10 March1. On that basis world growth would be 3.1% in 2026, 0.2 percentage point lower than in January, with headline inflation rising to 4.4%1. Without the war, the Fund said, it would have revised growth up, to 3.4%2.
Bar chart of the IMF's April 2026 cases for world growth in 2026: 3.4% on pre-war assumptions, 3.1% in the reference forecast, 2.5% in the adverse scenario and 2.0% in the severe scenario.
Source International Monetary Fund, World Economic Outlook April 2026 and IMF Blog, 14 Apr 2026. Figures as reported by the named organisations; facts cited with attribution.
Data (CSV) · SVG · PNG

Latest values as a table
| Value | |
|---|---|
| Pre-war assumptions (IMF counterfactual) | 3.4% |
| Reference forecast (short war, fades by mid-2026) | 3.1% |
| Adverse scenario (inflation 5.4%) | 2.5% |
| Severe scenario (inflation above 6%) | 2% |
Then it printed the alternatives. In an adverse scenario, growth falls to 2.5% and inflation rises to 5.4%; in a severe one, where disruptions extend into 2027, growth falls to 2% this year and next and inflation exceeds 6%2. Reuters reported the same day that the world was “already drifting toward a more adverse scenario”, and that the reference case assumed oil averaging $82 a barrel in 2026, well below the futures price of about $963.
Why this matters for you. A reference forecast is not a prediction; it is a conditional sentence with the condition in small print. If your budget, your pay round or your mortgage plan borrowed the 3.1%, it also borrowed the assumption that the strait would reopen by summer. The useful reading of April was to price the condition, not the headline.
Hindsight. The condition failed; the number, curiously, held. In October the IMF still projected 3.1% for 2026, “broadly unchanged from April, despite a more persistent energy market disruption than anticipated”5. The economy bent around the shock through rerouting, inventories and an investment boom5. The footnote was wrong and the headline survived, which is the most dangerous kind of right: it teaches people to skip the footnote.
What it left behind
A forecast tells you what the forecaster assumed. Read the assumption; it ages faster than the number.
Sources
- World Economic Outlook, April 2026: Global Economy in the Shadow of War – Executive Summary — International Monetary Fund, 14 Apr 2026.
- War Darkens Global Economic Outlook and Reshapes Policy Priorities — IMF Blog, 14 Apr 2026.
- IMF cuts growth outlook, warns world already drifting toward more adverse scenario — Reuters, 14 Apr 2026.
- Crude Oil Prices: Brent – Europe (DCOILBRENTEU), EIA spot price — U.S. EIA via FRED, St. Louis Fed, accessed 16 Oct 2026.
- Iran: Background and U.S. Policy (CRS report R45281) — Congressional Research Service, updated Aug 2026.
- Global Economic Resilience Is Under Strain, Demanding Decisive Policy Action — IMF Blog, 13 Oct 2026.
Every figure in this piece traces to a source above or to the desk’s own arithmetic on those sources, marked as such. Quotations are short and attributed. Spot an error? Write to the desk; corrections are logged on the method page.
Commentary for information only. Not investment, legal, tax, medical or political advice. Not an offer or solicitation. Analysis may be incomplete or wrong. Charts show published public data, not a trading feed; binding numbers live with the institutions that publish them.