Event
The month a strait became a price
Twenty million barrels a day stopped moving, and the world's emergency cupboard opened wider than ever before. Both facts were true. Only one of them was a solution.
On 28 February the United States and Israel launched joint air strikes on Iran1. On 2 March Iran’s Revolutionary Guards announced the closure of the Strait of Hormuz, and traffic fell to an average of about five vessels a day, against roughly a hundred before the war4. By the time the IEA published its March oil report on the 12th, flows of crude and products through the strait had gone “from around 20 mb/d before the war to a trickle”, and Gulf producers had cut output by at least 10 million barrels a day1. The agency called it “the largest supply disruption in the history of the global oil market”1.
The screen and the cargo. The physical price moved first and furthest. On the EIA’s spot series Brent was $71.32 on 27 February and $126.69 on 31 March, a rise of about 78% in a month on the desk’s arithmetic5. Futures were calmer: the IEA noted Brent futures had traded “within a whisker of $120” before easing to around $92 as it went to press1. Two prices, one barrel, and the gap between them was the cost of actually having the oil.
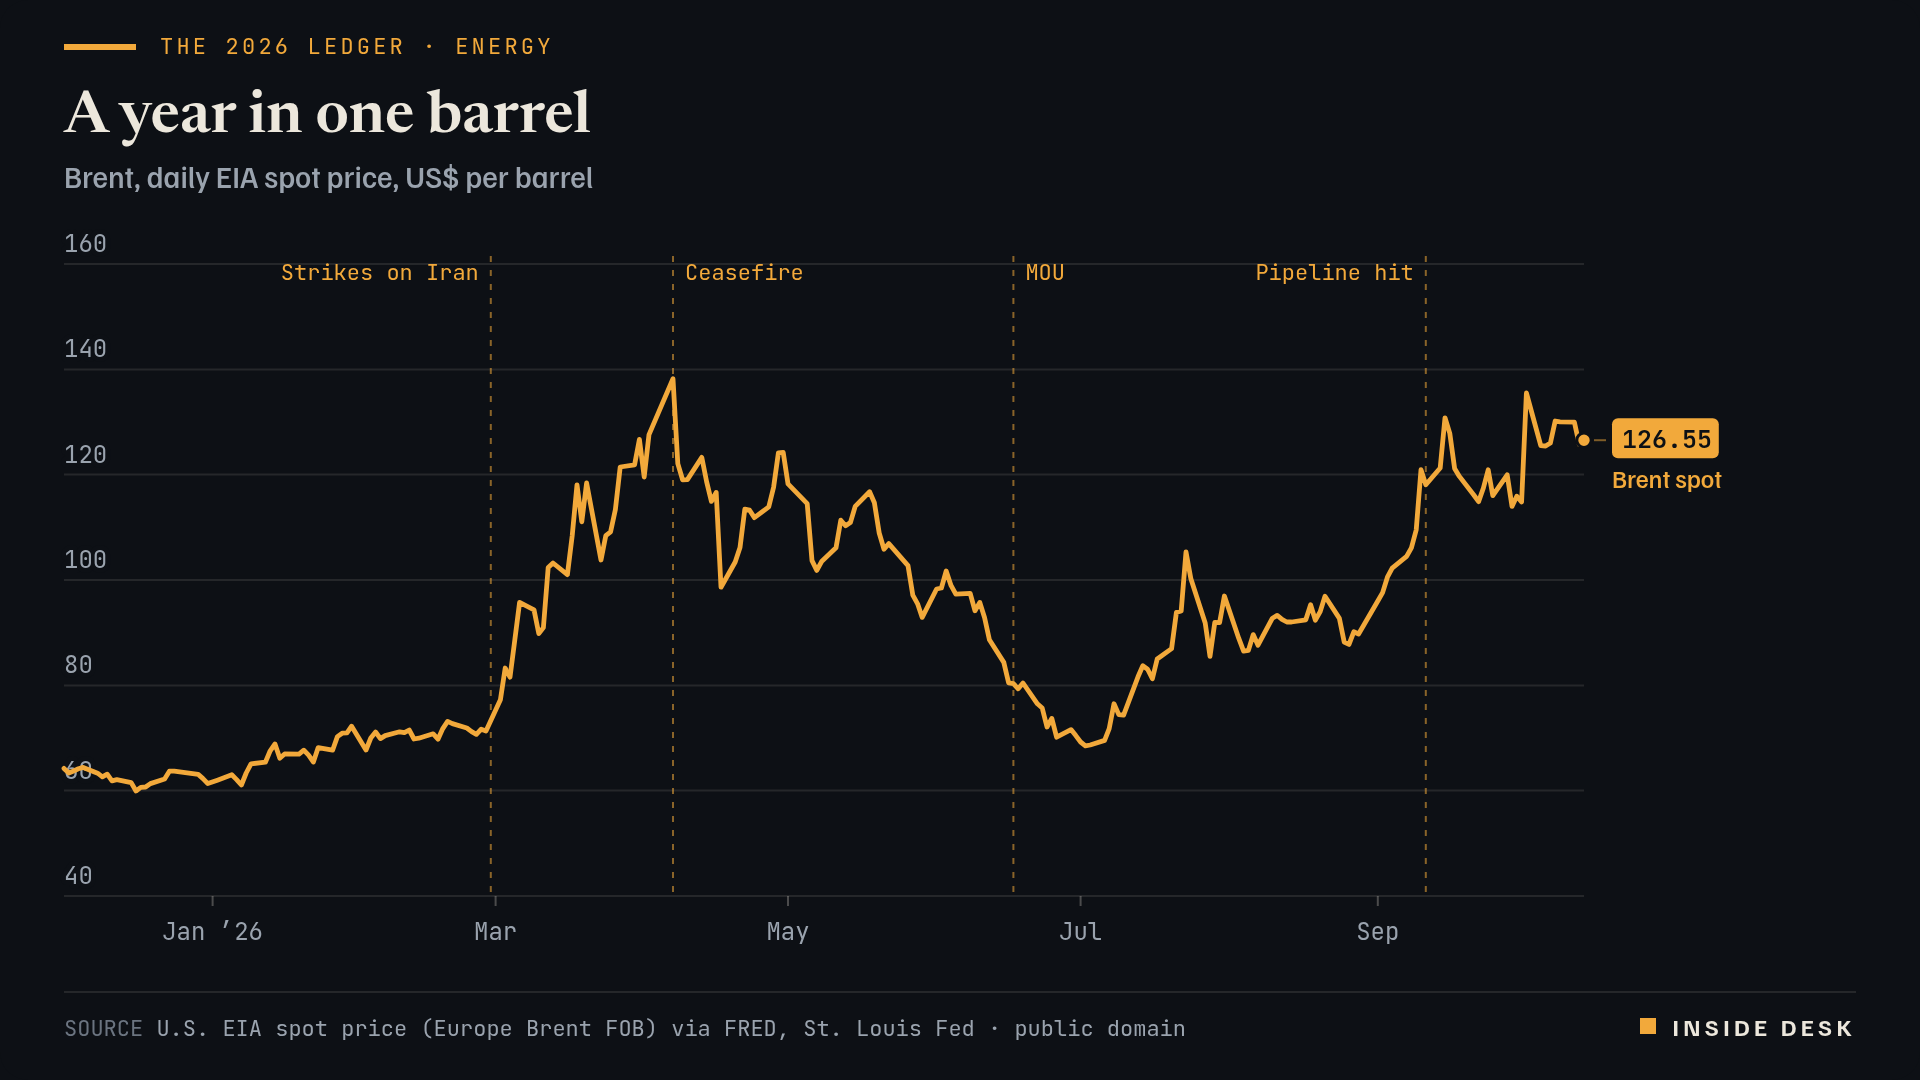
Line chart of the daily Brent spot price from December 2025. It trades between about $60 and $73 until the end of February 2026, then jumps after the strikes on Iran to $126.69 at the end of March and a peak of $138.21 on 7 April, the day of the ceasefire. It falls to $68.53 in early July after the June memorandum, climbs again to above $120 in mid-September after the Saudi pipeline is hit, and is $126.55 on 14 October.
Source U.S. EIA spot price (Europe Brent FOB) via FRED, St. Louis Fed · public domain. EIA spot prices via FRED, Federal Reserve Bank of St. Louis. U.S. government data, public domain.
Data (CSV) · SVG · PNG

Latest values as a table
| Date | Brent spot |
|---|---|
| 2026-10-07 | 126 |
| 2026-10-08 | 130.18 |
| 2026-10-09 | 130.03 |
| 2026-10-12 | 129.95 |
| 2026-10-13 | 125.78 |
| 2026-10-14 | 126.55 |
The cupboard opened. On 11 March all 32 IEA member countries agreed unanimously to make 400 million barrels of emergency stocks available2. It was the sixth collective action since the agency was founded in 1974, after 1991, 2005, 2011 and twice in 20222, and by the IEA’s own description “by far the largest ever”3. Members held more than 1.2 billion barrels of emergency stockpiles, plus 600 million barrels of industry stocks held under government obligation2.
Same units, please. Four hundred million barrels sounds like an answer. Measured against a disruption of nearly 20 million barrels a day1, it is about twenty days of the missing flow, on the desk’s arithmetic, released over months rather than days3. The IEA said as much, in calmer words: the release was “a significant and welcome buffer”, and the most important factor for stable flows was “the resumption of regular transit of shipping through the Strait of Hormuz”3.
Hindsight. March taught the year’s central lesson early. Stocks buy time; corridors decide prices. Every later month in this ledger is, in one way or another, a footnote to that sentence. If you run a business with a fuel bill, the useful question from March was never “how much is being released?” but “when do ships move again, and who insures them?”
What it left behind
An emergency stock is a loan from the future. It is repaid in the next crisis.
Sources
- Oil Market Report – March 2026 — International Energy Agency, 12 Mar 2026.
- IEA Member countries to carry out largest ever oil stock release amid market disruptions from Middle East conflict — International Energy Agency, 11 Mar 2026.
- Update on IEA collective action decision of 11 March 2026 — International Energy Agency, 15 Mar 2026.
- How a 95 percent drop in Hormuz traffic changed global shipping — Al Jazeera, 27 Aug 2026.
- Crude Oil Prices: Brent – Europe (DCOILBRENTEU), EIA spot price — U.S. EIA via FRED, St. Louis Fed, accessed 16 Oct 2026.
Every figure in this piece traces to a source above or to the desk’s own arithmetic on those sources, marked as such. Quotations are short and attributed. Spot an error? Write to the desk; corrections are logged on the method page.
Commentary for information only. Not investment, legal, tax, medical or political advice. Not an offer or solicitation. Analysis may be incomplete or wrong. Charts show published public data, not a trading feed; binding numbers live with the institutions that publish them.