Sunday long-read · Sunday, 1 November 2026
The Sunday Sequence: three days up on a prospectus, two days down on the invoices
The week opened on an IPO filing and closed on cash-flow statements. The S&P 500 lost 0.57%. The order of the days explains more than the total.
On Sundays this desk puts the week back in order: not by the size of the headlines but by when prices moved. This week the order was simple to describe and instructive to read. Three days of buying on a promise, then two days of selling on the accounts.
Monday: a prospectus. Anthropic filed publicly for a stock-market listing, and chipmakers rallied on it1. The S&P 500 rose 0.7% to 7,676.77 and the Nasdaq 0.82% to 26,169.381. The iShares semiconductor fund rose nearly 3%, and Brent fell 0.8% to $115.81 a barrel1. The filing was not a profit. It was an invitation to imagine one.
Tuesday: a loan. Banks and Blackstone announced $63 billion of financing for buying Broadcom technology for Anthropic, and Broadcom rose 4%2. The S&P 500 gained 0.6% to 7,722.60 and the Nasdaq 1.18% to 26,477.812. Brent fell 1.67% to $113.882. Note the instrument: the good news of the day was a debt arrangement.
Wednesday: a pause. The Federal Reserve held rates at 3.75% to 4%, as futures had priced at almost 93%3. The S&P 500 rose 0.28% to 7,743.98, its third winning day in a row3. Then Alphabet and Microsoft reported after the bell3.
Thursday: the first invoice. Alphabet’s revenue missed and its cash burn accelerated; the shares fell 12.6%4. The Nasdaq lost 1.37% to 26,184.72, the S&P 500 0.30%4. Yet small companies rose: the Russell 2000 gained 1.0%4. “Cracks in the AI story” did not mean “cracks in every corner of the market,” said Baird’s Ross Mayfield4.
Friday: the second invoice. Amazon reported negative free cash flow of $42.4 billion, Intel fell almost 29% on a weak outlook, and the Nasdaq lost 2.86% to 25,437.00, its worst day since June5. The S&P 500 fell 1.82% to 7,580.07; staples and healthcare rose5. On the week, the S&P 500 lost 0.57%6. Desk arithmetic: from Wednesday’s close to Friday’s, the S&P 500 gave up 2.1%, more than the three good days had added.
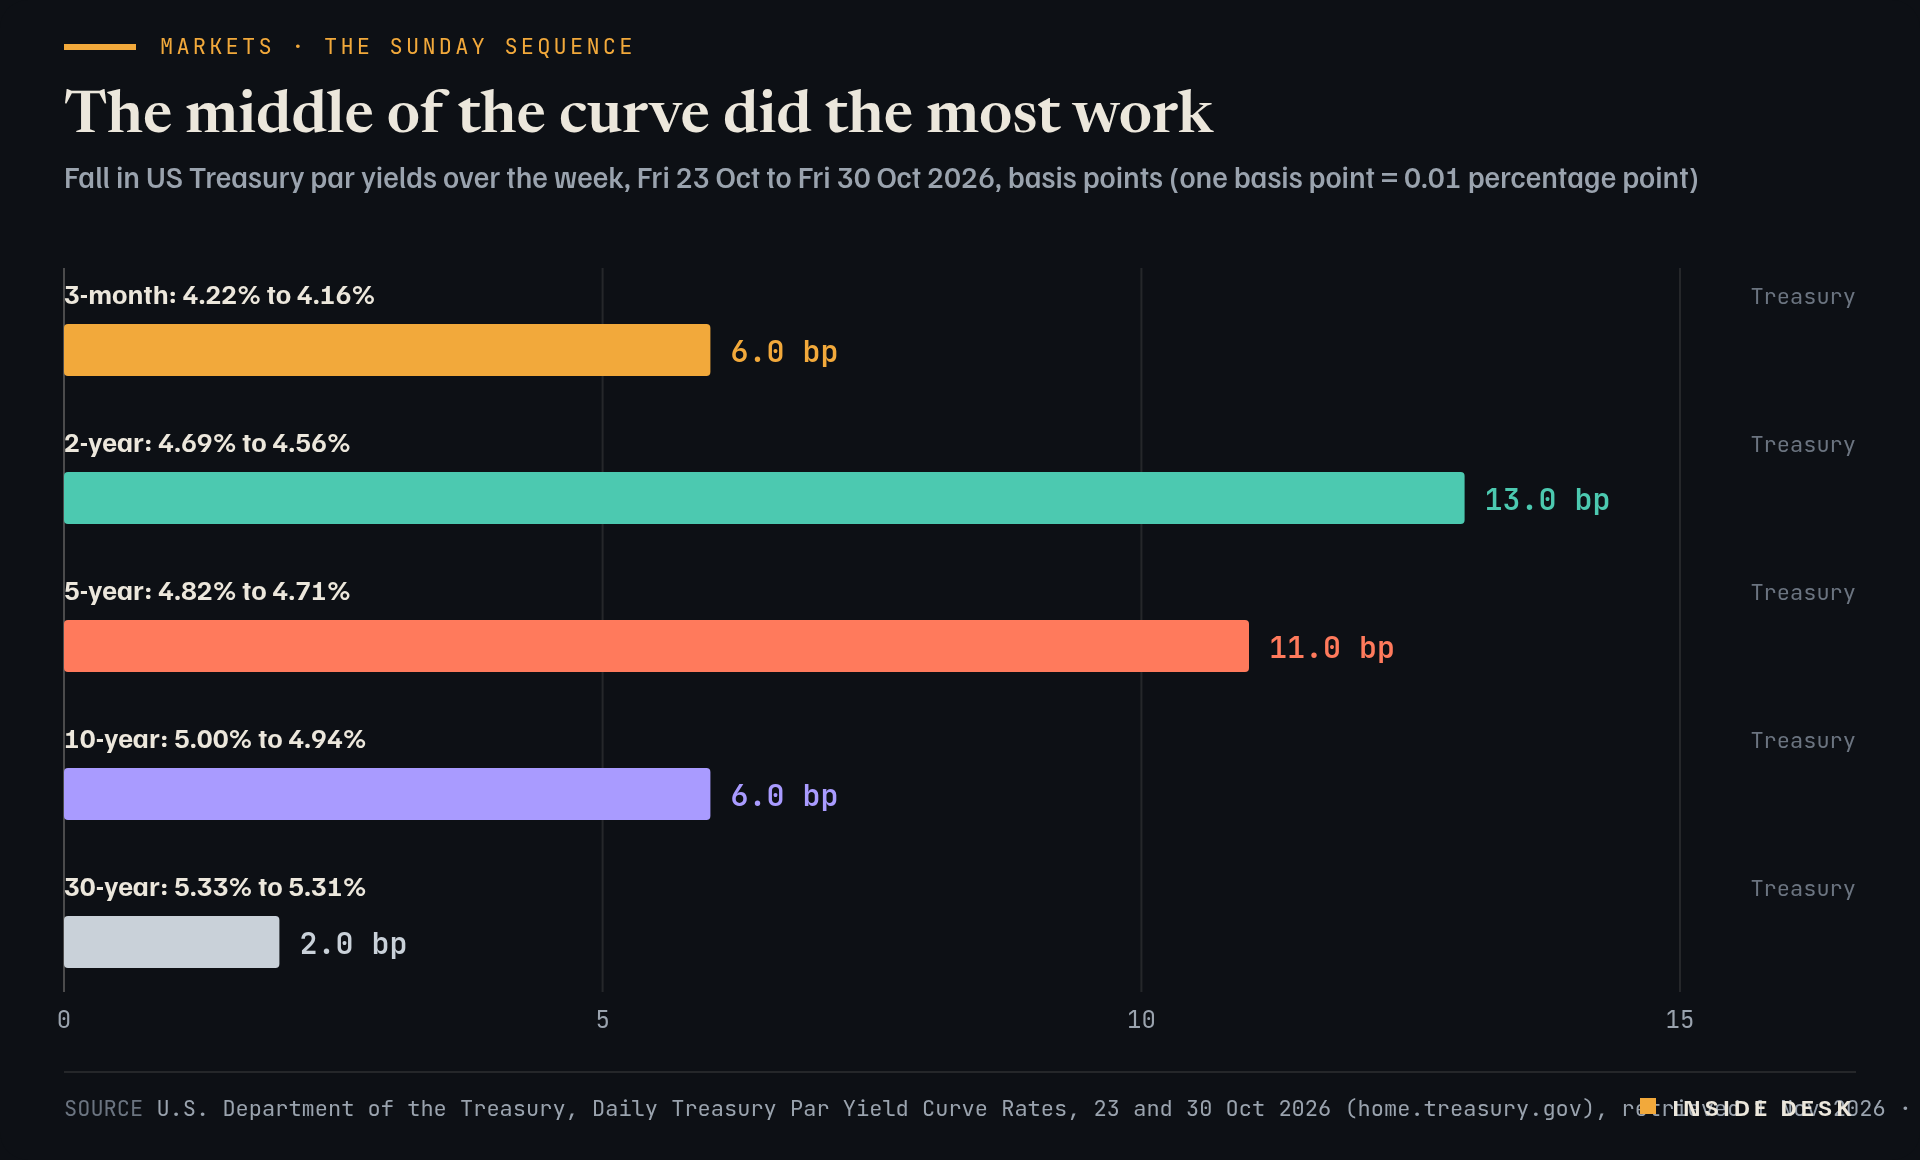
Underneath, the bonds. While the shares swung, Treasuries rallied all week. The 2-year yield fell from 4.69% to 4.56% and the 10-year from 5.00% to 4.94% between the two Fridays7. The middle of the curve moved most; the 30-year barely moved.
Bar chart of how far US Treasury par yields fell over the week from Friday 23 October to Friday 30 October 2026, in basis points. The 3-month yield fell 6, from 4.22% to 4.16%. The 2-year fell 13, from 4.69% to 4.56%, the largest move. The 5-year fell 11, from 4.82% to 4.71%. The 10-year fell 6, from 5.00% to 4.94%. The 30-year fell 2, from 5.33% to 5.31%. All yields were lower on the week; the latest values are the 30 October closes.
Source U.S. Department of the Treasury, Daily Treasury Par Yield Curve Rates, 23 and 30 Oct 2026 (home.treasury.gov), retrieved 1 Nov 2026 · U.S. government data, public domain · Bars are desk arithmetic: the difference between the two closing yields.. Figures as reported by the named organisations; facts cited with attribution.
Data (CSV) · SVG · PNG

Latest values as a table
| Value | |
|---|---|
| 3-month: 4.22% to 4.16% | 6 bp |
| 2-year: 4.69% to 4.56% | 13 bp |
| 5-year: 4.82% to 4.71% | 11 bp |
| 10-year: 5.00% to 4.94% | 6 bp |
| 30-year: 5.33% to 5.31% | 2 bp |
What the order says. Promises and financing moved prices up; cash-flow statements moved them down. That is not panic. It is the old machinery of quarterly accounts doing its job, a week late for those who bought on Monday. If you hold a broad fund, the bond half did what it is there for. Nothing here is investment advice.
What to watch
- The US midterm elections on Tuesday 3 November, which CNBC said traders were already de-risking ahead of on Friday5.
- Whether Friday's move into consumer staples and healthcare holds once the month-end selling is over5.
- The 2-year yield, which CNBC said was on course to close below its 50-day average for the first time since August5.
Monday bought the story, Friday read the cash-flow statement. The market is a slow reader, not a stupid one.
Sources
- Stock market news for Oct. 26, 2026 — CNBC, 26 Oct 2026.
- Stock market news for Oct. 27, 2026 — CNBC, 27 Oct 2026.
- Stock market news for Oct. 28, 2026 — CNBC, 28 Oct 2026.
- Wall Street ends lower as Alphabet revenue miss revives AI capex jitters — Reuters via StreetInsider, 29 Oct 2026, 19:40 CET.
- Stock market rocked as investors dump tech shares; Nasdaq suffers worst day since June — CNBC, 30 Oct 2026, 21:20 CET.
- Weekly Review - 10/30/2026 — Nasdaq Dorsey Wright, 30 Oct 2026.
- Daily Treasury Par Yield Curve Rates, 2026 — U.S. Department of the Treasury, retrieved 1 Nov 2026.
Every figure in this piece traces to a source above or to the desk’s own arithmetic on those sources, marked as such. Quotations are short and attributed. Spot an error? Write to the desk; corrections are logged on the method page.
Commentary for information only. Not investment, legal, tax, medical or political advice. Not an offer or solicitation. Analysis may be incomplete or wrong. Charts show published public data, not a trading feed; binding numbers live with the institutions that publish them.