Morning edition · Tuesday, 27 October 2026
Podium vs Print: "price stability" and 4.68%
The Fed chair says the Fed made clear it would deliver price stability, and declines to say what comes next. The two-year Treasury yield has been answering since February.
“We made very clear that we would deliver price stability, and we removed a dose of accommodation about a month ago.”
Kevin Warsh, Chair of the Federal Reserve, at the IMF and World Bank annual meetings in Bangkok, quoted by Reuters, 16 October 2026
4.68%
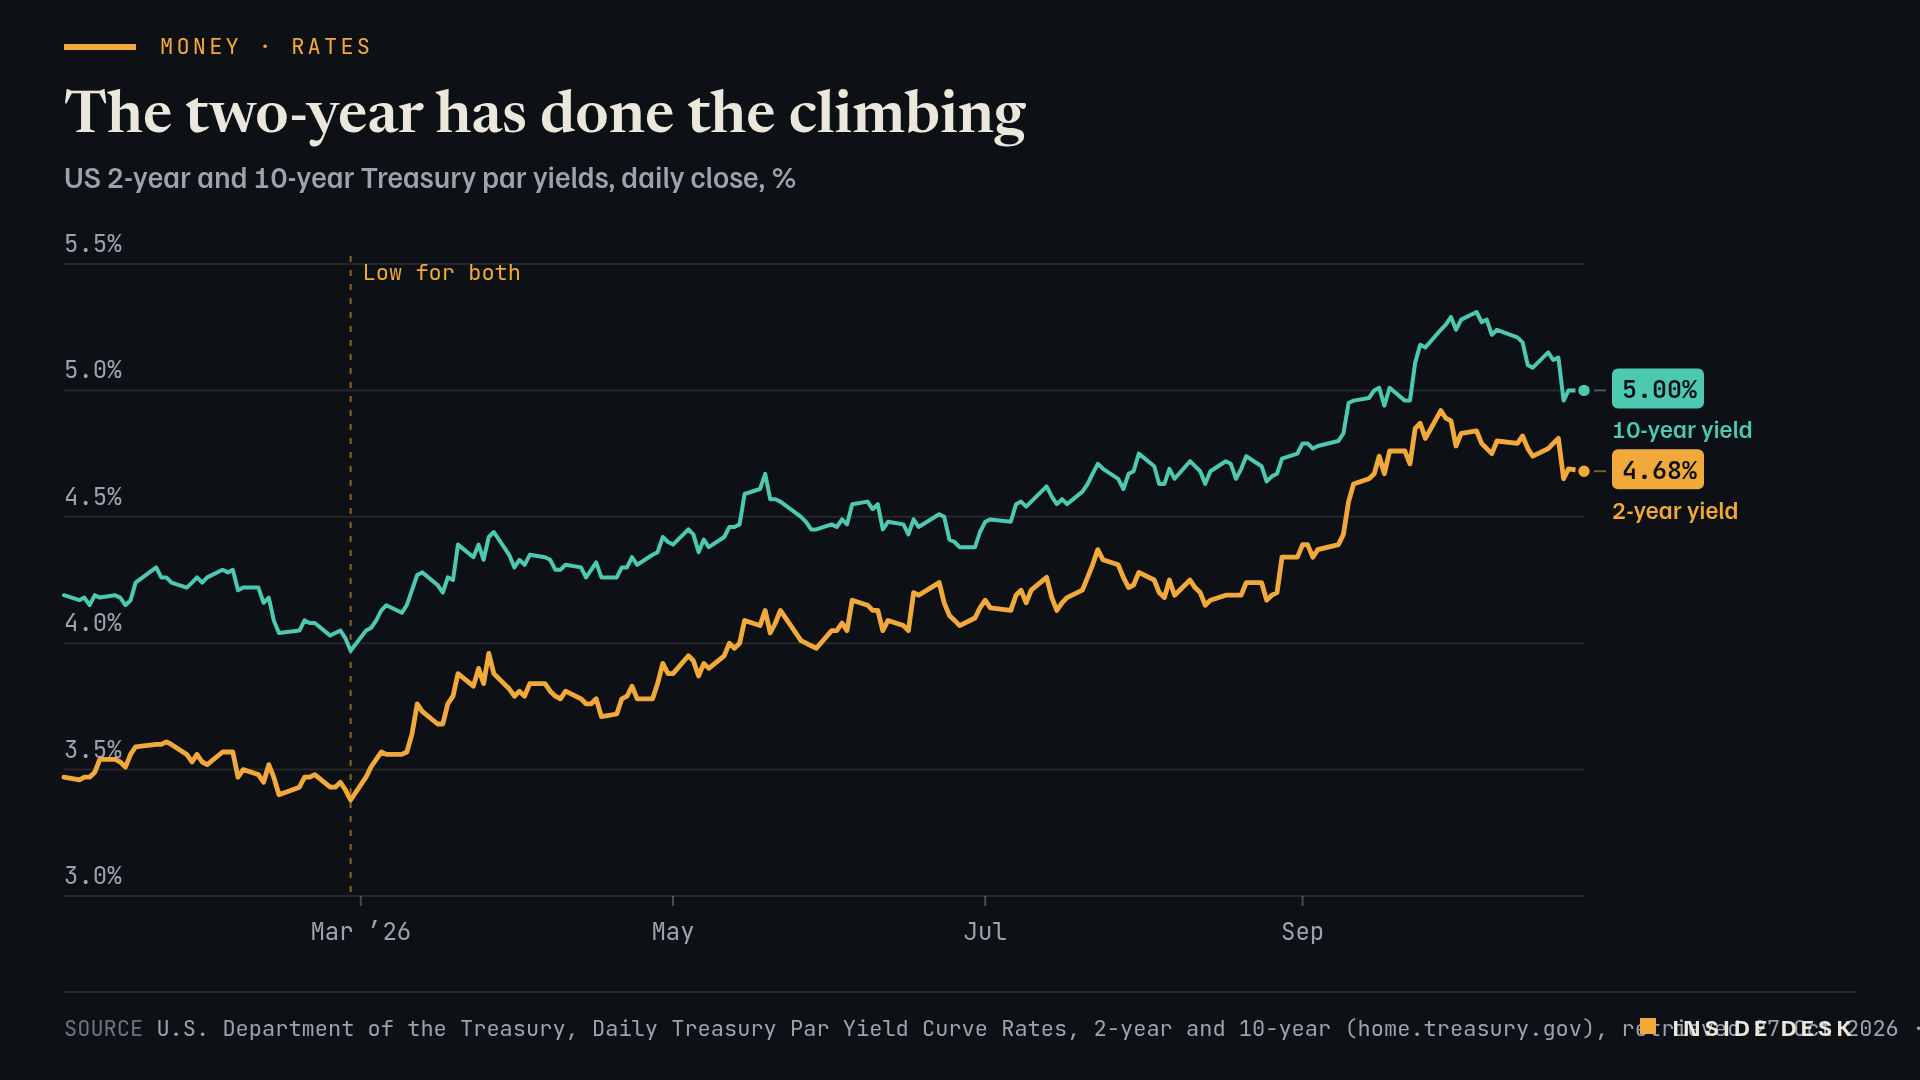
The US two-year par yield, up from 3.47% on 2 January and 3.38% at its low on 27 February. The ten-year closed at 5.00%.
U.S. Treasury, Daily Treasury Par Yield Curve Rates, Monday 26 October 2026 close, retrieved 27 October 2026
The podium. “We made very clear that we would deliver price stability, and we removed a dose of accommodation about a month ago,” Fed Chair Kevin Warsh said in Bangkok, referring to September’s rate rise1. On the next step he was firm in the other direction: “I don’t prejudge meetings”1.
The print. The US Treasury’s daily par yield curve shows the two-year yield at 4.68% at Monday’s close, against 3.47% on 2 January and a low of 3.38% on 27 February2. The ten-year closed at 5.00%2. Desk arithmetic: since 2 January the two-year has risen 1.21 percentage points and the ten-year 0.81. The gap between them has narrowed from 0.72 to 0.32 points.
Line chart of the daily US 2-year and 10-year Treasury par yields since January 2026. On 2 January the 2-year is at 3.47% and the 10-year at 4.19%. Both are at their lows on 27 February, 3.38% and 3.97%. The 2-year peaks at 4.92% on 28 September and the 10-year at 5.31% on 5 October. On Monday 26 October 2026, the latest value, the 2-year is at 4.68% and the 10-year at 5.00%, a gap of 0.32 percentage points, down from 0.72 at the start of the year.
Source U.S. Department of the Treasury, Daily Treasury Par Yield Curve Rates, 2-year and 10-year (home.treasury.gov), retrieved 27 Oct 2026 · U.S. government data, public domain. Figures as reported by the named organisations; facts cited with attribution.
Data (CSV) · SVG · PNG

Latest values as a table
| Date | 2-year yield | 10-year yield |
|---|---|---|
| 2026-10-19 | 4.77 | 5.15 |
| 2026-10-20 | 4.79 | 5.12 |
| 2026-10-21 | 4.81 | 5.13 |
| 2026-10-22 | 4.65 | 4.96 |
| 2026-10-23 | 4.69 | 5 |
| 2026-10-26 | 4.68 | 5 |
The gap. The chair speaks about meetings; the two-year prices them. It is the maturity most sensitive to what a central bank does next, and it has climbed further this year than the long rate. Futures put the chance of a hike on Wednesday at under 10%, but nearly 75% expect at least one by the end of the year3. The Fed raised its range to 3.75%–4% in September, its first rise since 2023, with consumer prices up 3.7% on the year3.
The verdict. Both are honest. A chair who refuses to pre-announce keeps his options; a bond market that prices them anyway keeps its discipline. For you the print matters more: credit-card rates track the short end, and mortgages the long one, which has sat near 5%3. The podium will speak again on Wednesday. The curve already has. Nothing here is investment advice.
What to watch
- Wednesday evening, Berlin time: the Fed's statement and Warsh's press conference. Futures price less than a 10% chance of a hike this week and nearly 75% for at least one by year-end3.
- The two-year on Thursday morning. If it moves more than the ten-year, the market heard something about December.
A chair can decline to prejudge a meeting. A yield curve cannot decline to price one.
Sources
- Fed's Warsh sees US resilience, mum on rate-path view — Reuters via StreetInsider, 16 Oct 2026, 04:57 CEST.
- Daily Treasury Par Yield Curve Rates, 2026 — U.S. Department of the Treasury, retrieved 27 Oct 2026, 05:15 CET (data to 26 Oct).
- Federal Reserve is likely to hold interest rates steady in October. Here's what that means for consumers — CNBC, 26 Oct 2026, 20:51 CET.
Every figure in this piece traces to a source above or to the desk’s own arithmetic on those sources, marked as such. Quotations are short and attributed. Spot an error? Write to the desk; corrections are logged on the method page.
Commentary for information only. Not investment, legal, tax, medical or political advice. Not an offer or solicitation. Analysis may be incomplete or wrong. Charts show published public data, not a trading feed; binding numbers live with the institutions that publish them.