Evening edition · Friday, 16 October 2026
The pump is the honest print
Inflation is 3.8% on average. Nobody lives on the average. Which pipe comes into your house decides your year.
Averages are for committees. Households live inside categories, and Eurostat’s September detail shows how unevenly this shock lands1.
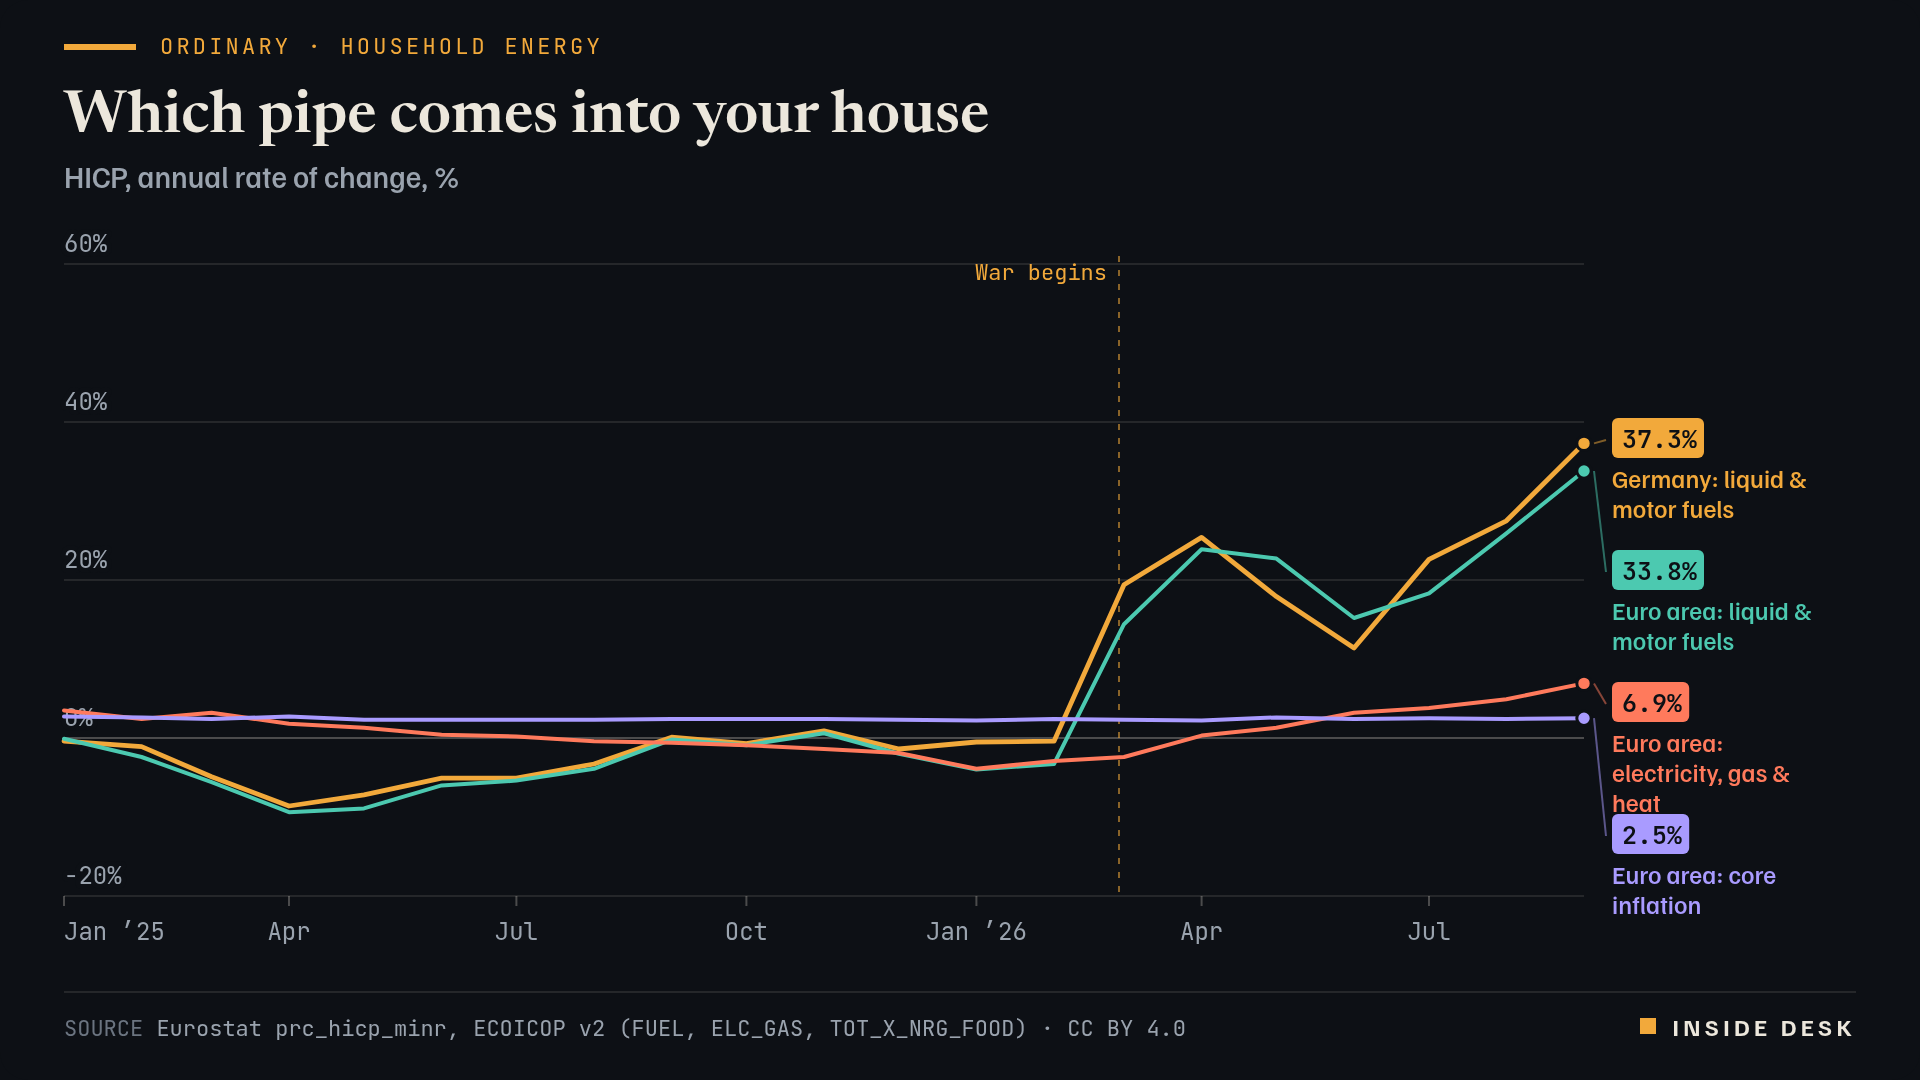
Liquid fuels and fuels for transport (petrol, diesel, heating oil) cost 33.8% more across the euro area than a year earlier. In Germany the same category was up 37.3%, from 27.5% in August1. Electricity, gas, solid fuels and heat, by contrast, were up 6.9% for the euro area. Everything outside energy, food, alcohol and tobacco: 2.5%1. German headline inflation on the harmonised measure was 3.3%, up from 2.9%1.
Line chart of annual price changes since January 2025. Liquid and motor fuels fall by up to about 9% a year in spring 2025, then jump after the war begins, reaching +33.8% in the euro area and +37.3% in Germany in September 2026. Electricity, gas and heat rise far less, to +6.9%, and core inflation stays near 2.5%.
Source Eurostat prc_hicp_minr, ECOICOP v2 (FUEL, ELC_GAS, TOT_X_NRG_FOOD) · CC BY 4.0. Eurostat. Reuse authorised under CC BY 4.0 (Commission Decision 2011/833/EU).
Data (CSV) · SVG · PNG

Latest values as a table
| Date | Germany: liquid & motor fuels | Euro area: liquid & motor fuels | Euro area: electricity, gas & heat | Euro area: core inflation |
|---|---|---|---|---|
| 2026-04-01 | 25.4 | 23.9 | 0.3 | 2.2 |
| 2026-05-01 | 17.9 | 22.7 | 1.3 | 2.6 |
| 2026-06-01 | 11.4 | 15.2 | 3.2 | 2.4 |
| 2026-07-01 | 22.6 | 18.3 | 3.8 | 2.5 |
| 2026-08-01 | 27.5 | 25.9 | 4.9 | 2.4 |
| 2026-09-01 | 37.3 | 33.8 | 6.9 | 2.5 |
So two neighbours on the same street can be living in different inflation rates. The one who commutes by diesel and heats with oil sits near the top line of that chart. The one on a fixed electricity tariff who takes the train sits near the bottom. The headline 3.8% describes neither of them precisely.
The constructive part is that this is legible. Fuel is the part of the bill that reacts fastest to the screen in today’s lead piece: up first, and eventually down first. Grid tariffs and gas contracts move more slowly, in both directions. If you are deciding when to fill a heating-oil tank, which tariff to sign, or how to argue for a travel allowance, you need your category, not the average. That is information, not advice. Your contract and your local prices are the binding numbers.
What to watch
- Pump and heating-oil prices in the European Commission's Weekly Oil Bulletin2.
- The heating season. Liquid fuels hit the oil-heated house first.
- October's HICP detail: fuel reacts to the screen fastest, in both directions.
Nobody lives on the average. Find your own line on the chart.
Sources
- HICP – monthly data, annual rate of change (prc_hicp_minr): FUEL, ELC_GAS, TOT_X_NRG_FOOD, TOTAL; euro area and Germany — Eurostat, released 16 Oct 2026.
- Weekly Oil Bulletin — European Commission, weekly.
Every figure in this piece traces to a source above or to the desk’s own arithmetic on those sources, marked as such. Quotations are short and attributed. Spot an error? Write to the desk; corrections are logged on the method page.
Commentary for information only. Not investment, legal, tax, medical or political advice. Not an offer or solicitation. Analysis may be incomplete or wrong. Charts show published public data, not a trading feed; binding numbers live with the institutions that publish them.