Evening edition · Friday, 13 November 2026
A flat Friday on top: Wise up 9.8%, Acciona down 7% underneath
Europe's indexes spent the last day of their best week since June barely moving. The shares inside them did not get the memo.
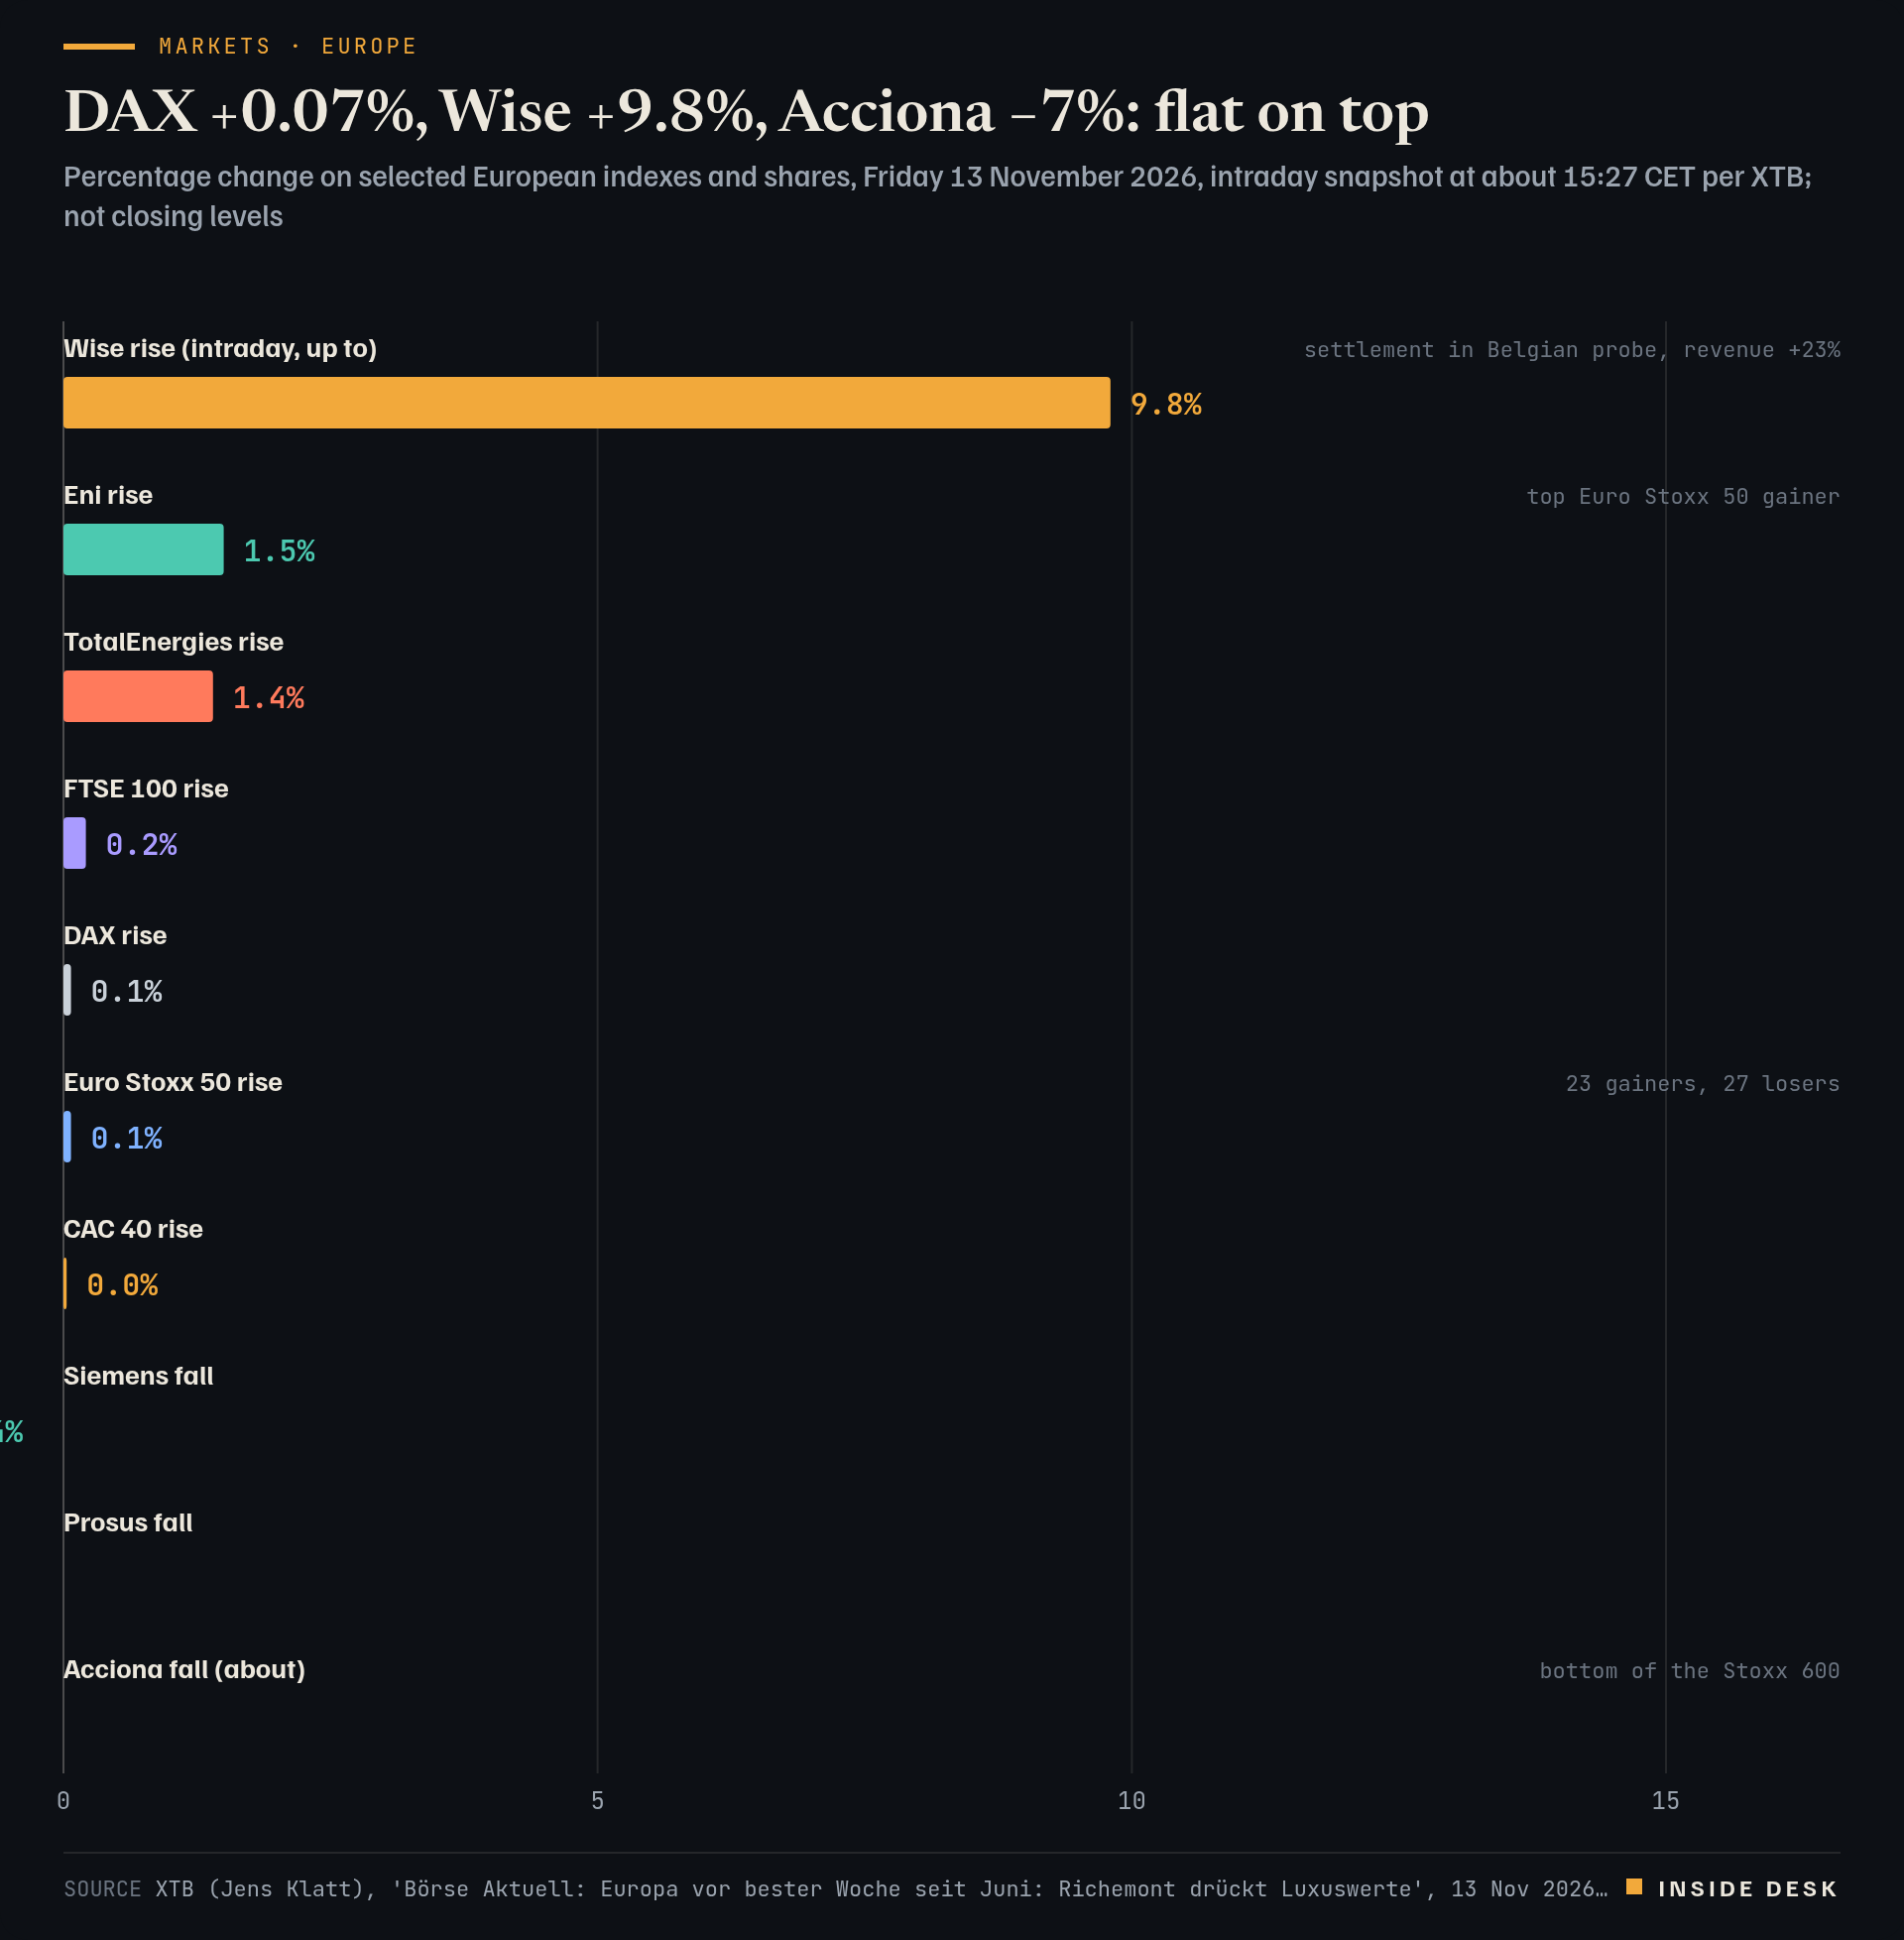
At 15:27 CET on Friday, the DAX and the Euro Stoxx 50 were each up 0.07%, the CAC 40 up 0.03% and the FTSE 100 up 0.21%, per XTB1. Among the fifty Euro Stoxx members, 23 were up and 27 down1. That is what a calm Friday looks like from above. These are snapshots, not closes; the settled numbers arrive after our press time.
Underneath, it was not calm. Wise rose as much as 9.8% after a settlement in a Belgian investigation and 23% revenue growth; Acciona fell about 7%, last in the Stoxx 600, after its renewables arm admitted it would miss a €2 billion asset-sale target1. Richemont, the owner of Cartier, lost between 4% and 6%, at one point 9%, although its half-year operating profit rose 33% to €3.13 billion1. Investors marked down slower jewellery growth, 14% in the second quarter after 24% in the first, and a 7% fall in Middle East and Africa sales1. The profit was a record; the share price graded the slope.
Bar chart of Friday 13 November 2026 percentage changes in Europe at about 15:27 CET, per XTB: Wise up as much as 9.8 percent, Eni up 1.5, TotalEnergies up 1.4, FTSE 100 up 0.21, DAX up 0.07, Euro Stoxx 50 up 0.07, CAC 40 up 0.03, Siemens down 1.4, Prosus down 1.75 and Acciona down about 7 percent. These are intraday snapshot figures, not closes.
Source XTB (Jens Klatt), 'Börse Aktuell: Europa vor bester Woche seit Juni: Richemont drückt Luxuswerte', 13 Nov 2026, 15:27 CET; intraday snapshot, not closing levels; Wise figure is its intraday high; retrieved 13 Nov 2026 · reported figures. Figures as reported by the named organisations; facts cited with attribution.
Data (CSV) · SVG · PNG

Latest values as a table
| Value | |
|---|---|
| Wise rise (intraday, up to) | 9.8% |
| Eni rise | 1.5% |
| TotalEnergies rise | 1.4% |
| FTSE 100 rise | 0.21% |
| DAX rise | 0.07% |
| Euro Stoxx 50 rise | 0.07% |
| CAC 40 rise | 0.03% |
| Siemens fall | -1.4% |
| Prosus fall | -1.75% |
| Acciona fall (about) | -7% |
The week is the bigger number. XTB put the Stoxx 600 on course for a weekly gain of about 2.4%, its best since June1; dpa-AFX had the DAX heading for about 3.7% on the week2. The reasons are on the invoices: XTB cites third-quarter profits for Stoxx 600 companies rising about 25%, the fastest in four years, with energy up roughly 151% and the rest still about 10%1. Europe’s indexes carry about 8.8% technology, against more than 35% on Wall Street, which is why the turmoil around Nvidia’s chief reached Frankfurt only faintly1.
The bill arrives in bonds. Bunds fell more than 100 ticks over the week, and the US ten-year yield touched 5.17%, its highest since 15 October, per Newsquawk3. Shares have had a good week. Borrowing has had a dear one. You will feel the second longer than the first.
For you. A flat index on a Friday is not a quiet market; it is ten loud ones cancelling out. If you own a fund, the average is your story. If you own three shares, read the three reports. Nothing here is investment advice.
What to watch
- Friday's settled closes, which come after this edition's press time; the figures here are afternoon snapshots.
- Whether the Stoxx 600 holds the roughly 2.4% weekly gain XTB reported at 15:27 CET1.
An index is an average; your portfolio is not.
Sources
- Börse Aktuell: Europa vor bester Woche seit Juni: Richemont drückt Luxuswerte — XTB (Jens Klatt), 13 Nov 2026, 15:27 CET.
- Aktien Frankfurt: Dax mit Verschnaufpause nach Rekordhoch — dpa-AFX via finanznachrichten.de, 13 Nov 2026, 14:42 CET.
- Newsquawk European Market Wrap - 13th November 2026 — Newsquawk, 13 Nov 2026, 16:20 CET.
Every figure in this piece traces to a source above or to the desk’s own arithmetic on those sources, marked as such. Quotations are short and attributed. Spot an error? Write to the desk; corrections are logged on the method page.
Commentary for information only. Not investment, legal, tax, medical or political advice. Not an offer or solicitation. Analysis may be incomplete or wrong. Charts show published public data, not a trading feed; binding numbers live with the institutions that publish them.