Morning edition · Wednesday, 11 November 2026
The wind came back for Wednesday, but mostly at night
SMARD's forecast has half as much again wind as Tuesday. It blows hardest at 03:00, when nobody needs it, and that is where Wednesday's price is cheapest.
You already know the headline number: Wednesday’s power was auctioned on Tuesday at a German-Luxembourg daily average of €316.65 per megawatt hour, a step down from two records1. This morning the more useful number sits one table over. SMARD’s generation forecast for Wednesday, which had not yet appeared when we checked on Tuesday afternoon, puts onshore and offshore wind together at about 148.1 gigawatt hours2. Desk arithmetic: that is about 49% more than the 99.1 GWh forecast for Tuesday and roughly double Monday’s 71.6 GWh2.
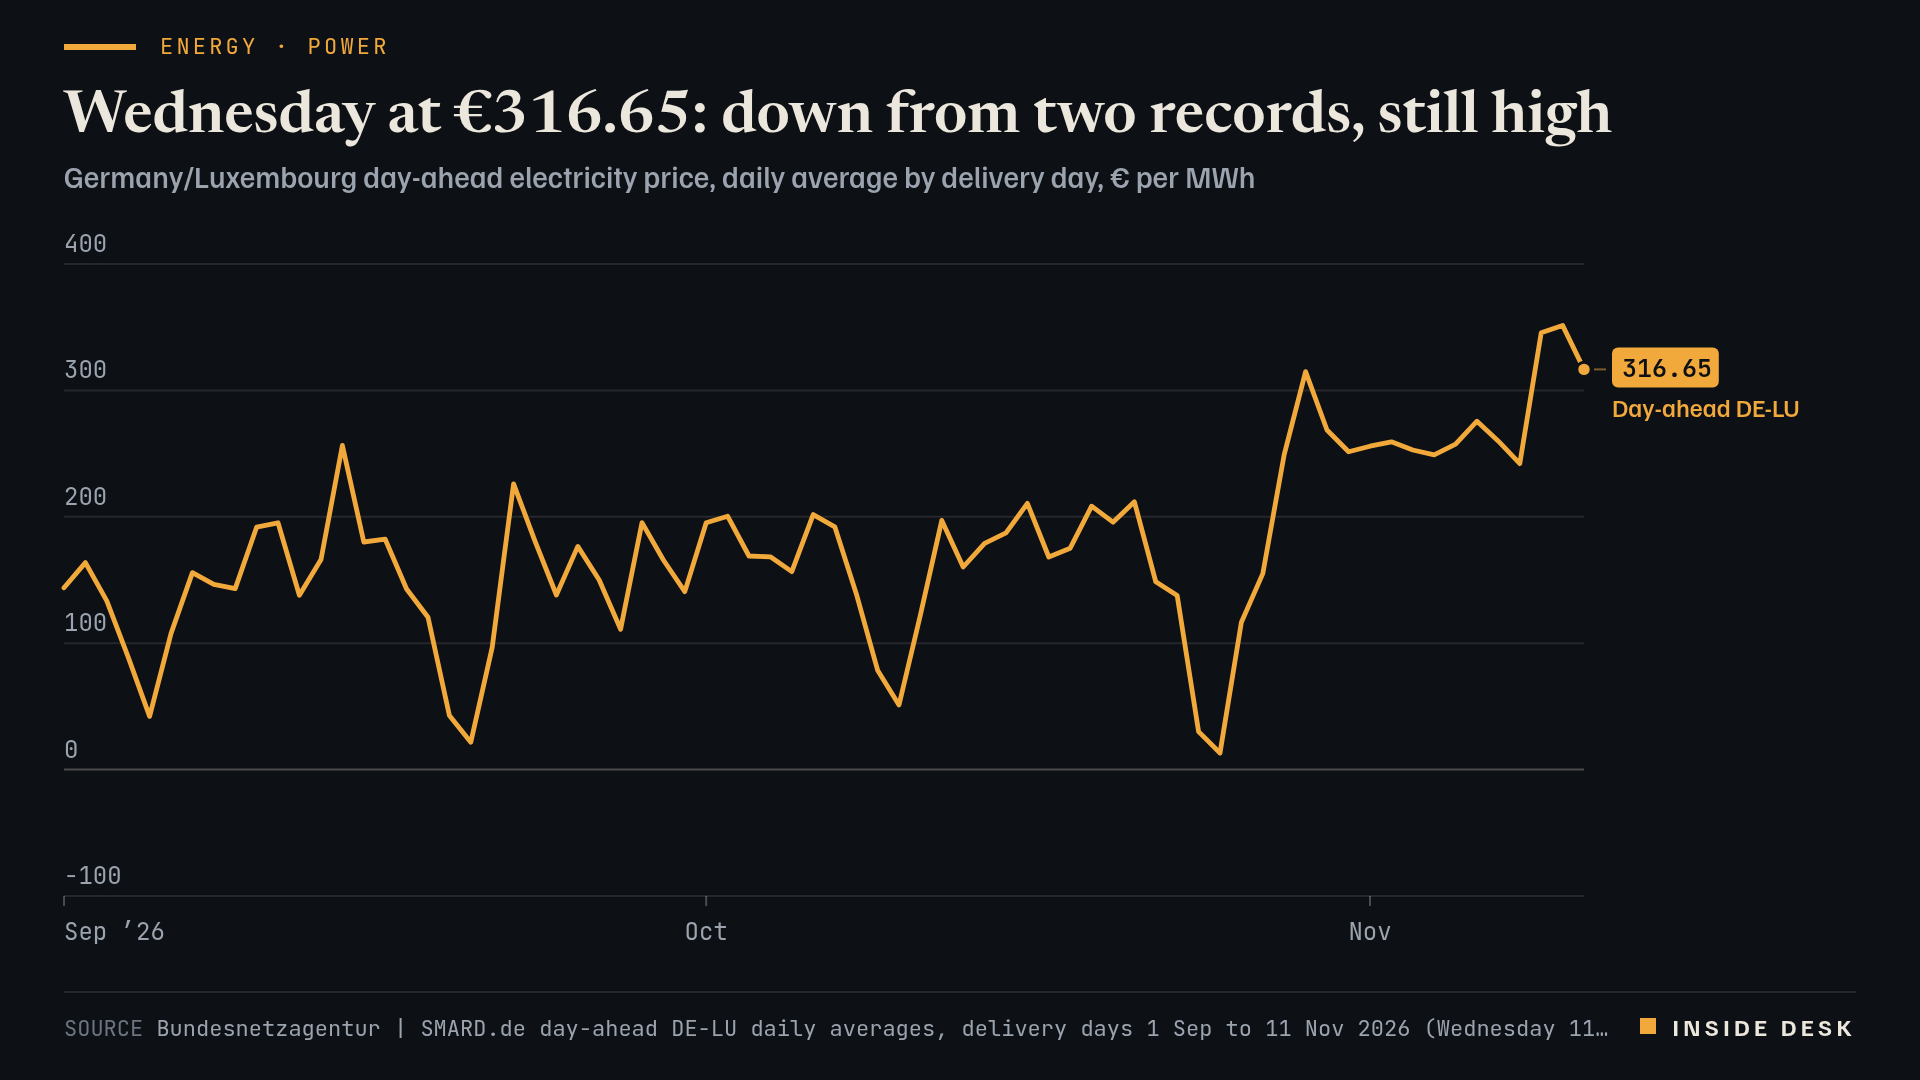
Line chart of the daily average German-Luxembourg day-ahead electricity price from 1 September to 11 November 2026, in euros per megawatt hour. It falls to €13.12 on Sunday 25 October, climbs to €314.85 on Thursday 29 October, and stays between €242.13 and €275.64 on every delivery day from 2 to 8 November. It jumps to €345.64 on Monday 9 November and a record €351.48 on Tuesday 10 November. The latest value is €316.65 for delivery on Wednesday 11 November, €34.83 below Tuesday and still higher than any delivery day before 9 November on the chart.
Source Bundesnetzagentur | SMARD.de day-ahead DE-LU daily averages, delivery days 1 Sep to 11 Nov 2026 (Wednesday 11 Nov €316.65, auction of 10 Nov), retrieved 11 Nov 2026, 05:17 CET · CC BY 4.0. Bundesnetzagentur | SMARD.de, market data. CC BY 4.0.
Data (CSV) · SVG · PNG

Latest values as a table
| Date | Day-ahead DE-LU |
|---|---|
| 2026-11-06 | 275.64 |
| 2026-11-07 | 259.83 |
| 2026-11-08 | 242.13 |
| 2026-11-09 | 345.64 |
| 2026-11-10 | 351.48 |
| 2026-11-11 | 316.65 |
The wind keeps night hours. The forecast has wind at about 8,728 megawatts at 03:00 but only about 4,433 MW at 17:002. Desk arithmetic: the night hour gets nearly twice the wind of the teatime hour. The price follows faithfully. 03:00 is Wednesday’s cheapest hour at €200.39, and 17:00 its dearest at €447.651. Solar does not help in the evening either, and on Wednesday it barely helps at noon: SMARD forecasts about 35.5 GWh of solar for the whole day, roughly half Tuesday’s 66.9 GWh2.
Why a 49% gain buys only 10%. Wind and sun are still a small slice of what the country will use. SMARD forecasts consumption of about 1,418 GWh for Wednesday2. Desk arithmetic: forecast wind and solar together cover about 12.9% of it, up from 11.6% on Tuesday and 10.8% on Monday. The rest comes from plants that burn something: on Monday, the last full day of realised data, gas plants delivered about 411.6 GWh, lignite 311.8 GWh and hard coal 122.0 GWh, against 77.8 GWh from wind2. That is why the daily average fell by €34.83, or about 9.9%, and not by half1.
For you. On a fixed tariff, none of this reaches your bill this month. On a dynamic tariff, Wednesday is a night-owl’s day: every hour from 00:00 to 05:00 clears between €200.39 and €215.85, and 16:00 to 19:00 all clear above €3901. Run the dishwasher before bed, charge the car overnight, and treat the forecast as a forecast. The grid operators plan with it. So can you. Nothing here is investment advice.
What to watch
A forecast of wind is not a megawatt. A megawatt at 03:00 is not a megawatt at 17:00.
Sources
- Marktdaten: Großhandelspreise DE/LU day-ahead, hourly and quarter-hourly (filter 4169) — Bundesnetzagentur | SMARD.de, retrieved 11 Nov 2026, 05:17 CET.
- Marktdaten: Prognostizierte Erzeugung, prognostizierter Verbrauch und realisierte Erzeugung (wind, solar, gas, lignite, hard coal), hourly — Bundesnetzagentur | SMARD.de, retrieved 11 Nov 2026, 05:22 CET.
Every figure in this piece traces to a source above or to the desk’s own arithmetic on those sources, marked as such. Quotations are short and attributed. Spot an error? Write to the desk; corrections are logged on the method page.
Commentary for information only. Not investment, legal, tax, medical or political advice. Not an offer or solicitation. Analysis may be incomplete or wrong. Charts show published public data, not a trading feed; binding numbers live with the institutions that publish them.