Morning edition · Monday, 2 November 2026
From 60 to 261 in two days: Delhi's smog season opens on schedule
Friday's rain gave the capital clean air; by Sunday night the index was at 290. The rules arrived on the same morning as the smoke, which is the point of having rules.
On Friday, after heavy rain and strong winds, Delhi recorded an air quality index of 60, “satisfactory”1. On Saturday it was 117. On Sunday the official 24-hour average reached 261, “poor”, and it kept climbing through the evening: 272 at 6pm, 287 at 10pm, 290 at 11pm local time1. It is the worst reading since 17 April, the Times of India notes, and the highest in 198 days2. Of the city’s 57 reporting stations, 22 were in the “very poor” band; Jahangirpuri was worst at 378, not far below the “severe” line at 4012.
The weather did not cause the smoke. It stopped carrying it away. Delhi’s minimum on Sunday was 18 degrees, 1.9 below the seasonal average, and a Hindustan Times reading of the Safdarjung weather balloon found the day’s pollution mixed only 1,100 metres up, in winds averaging 10 km/h; on a typical early-November afternoon it is about 1,300 metres and 13 km/h1. A lower lid and a slower breeze: the same emissions, less room.
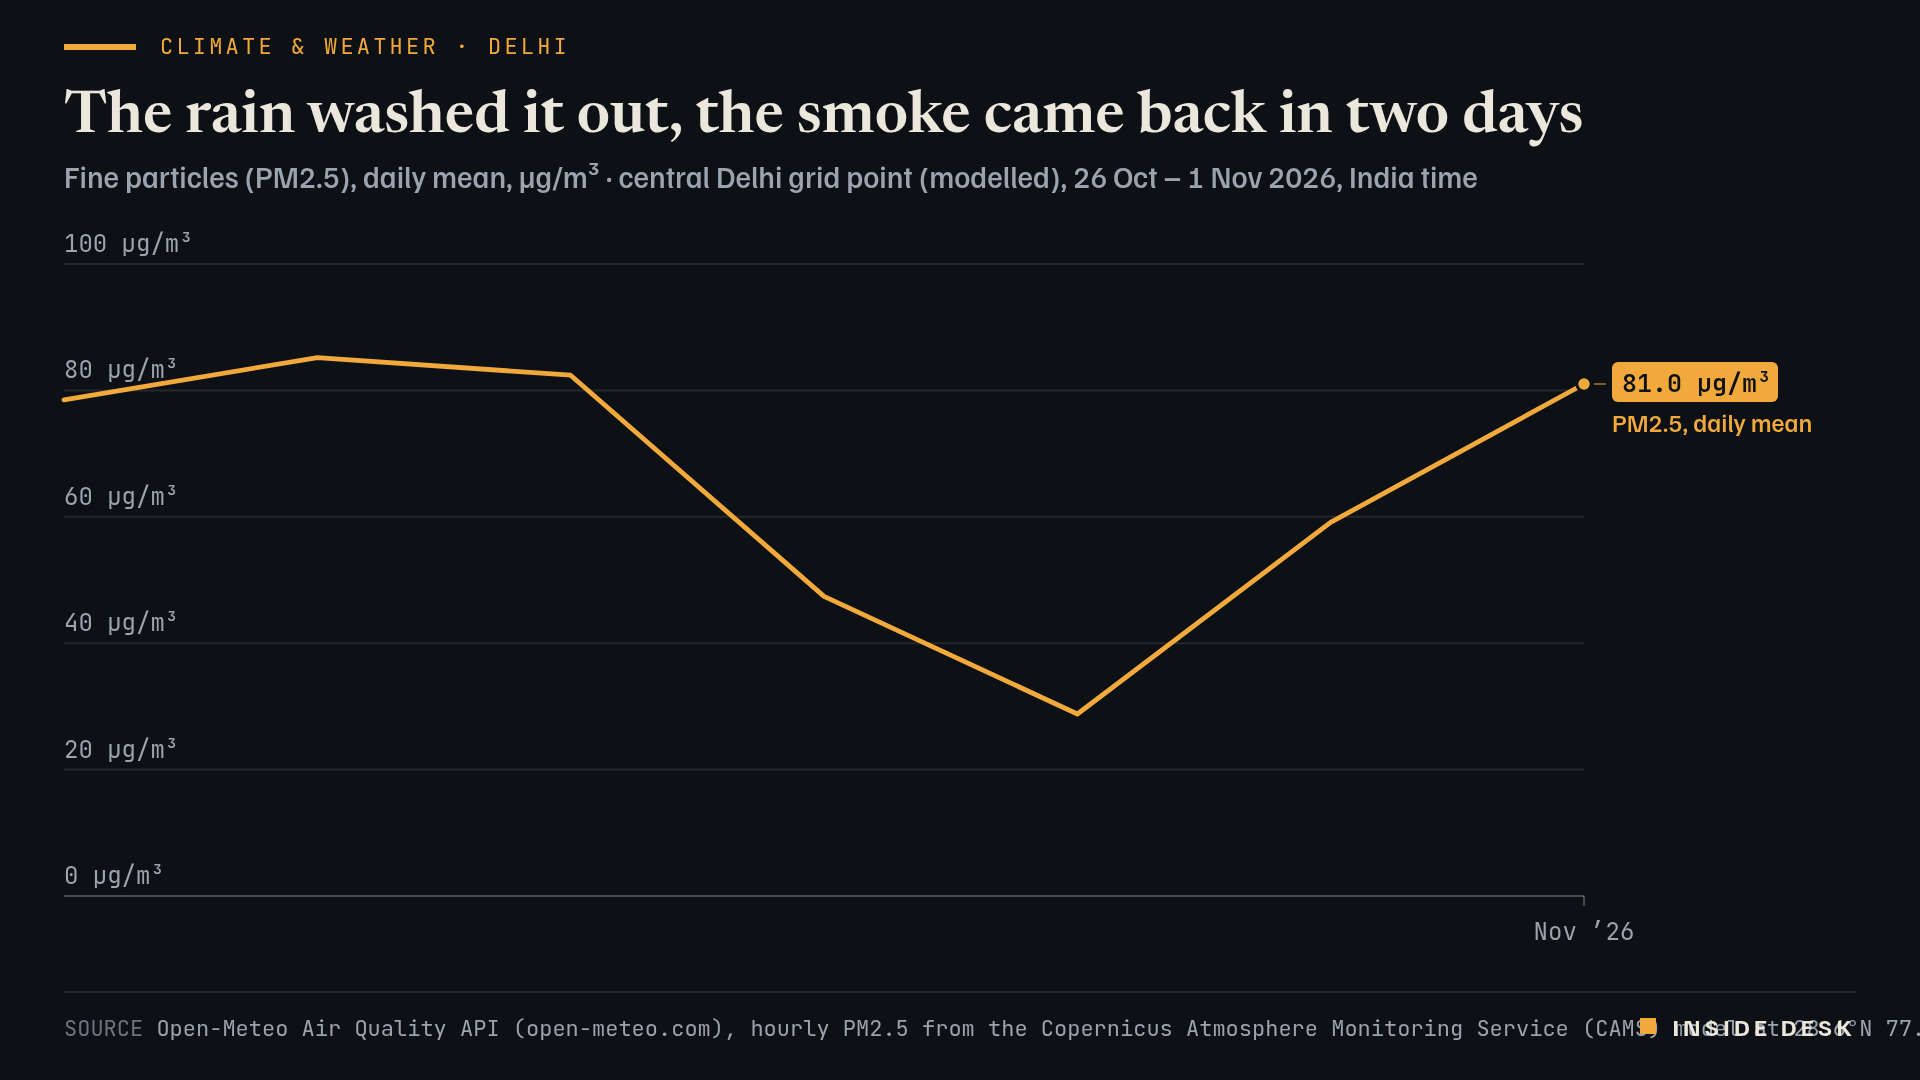
Line chart of modelled daily mean PM2.5 at a central Delhi grid point. It sits around 80 µg/m³ from 26 to 28 October, falls to 47.4 on 29 October and 28.8 on 30 October after rain, then climbs to 59.1 on 31 October and 81.0 µg/m³ on Sunday 1 November 2026, the latest value.
Source Open-Meteo Air Quality API (open-meteo.com), hourly PM2.5 from the Copernicus Atmosphere Monitoring Service (CAMS) model at 28.6°N 77.2°E, desk daily means of 24 hourly values (Asia/Kolkata days); retrieved 2 Nov 2026 · Open-Meteo data CC BY 4.0, contains Copernicus Atmosphere Monitoring Service information. Modelled grid values, not CPCB station readings.. Figures as reported by the named organisations; facts cited with attribution.
Data (CSV) · SVG · PNG

Latest values as a table
| Date | PM2.5, daily mean |
|---|---|
| 2026-10-27 | 85.2 |
| 2026-10-28 | 82.4 |
| 2026-10-29 | 47.4 |
| 2026-10-30 | 28.8 |
| 2026-10-31 | 59.1 |
| 2026-11-01 | 81 |
The model view tells the same story in fine particles. Open-Meteo’s CAMS series for a central Delhi grid point shows PM2.5 near 80 µg/m³ early last week, a dip to 28.8 on Friday after the rain, and a return to 81.0 by Sunday3. Desk arithmetic: the rain bought roughly two days.
Where it comes from matters more than the number. The government’s decision-support system put stubble burning at 18.57% of Delhi’s pollution on Sunday, up from 5.33% on Saturday; transport inside the city was 16.4%1,2. One analyst told the HT that two-thirds of the fine particles come from outside the city1. A city cannot legislate its neighbours’ fields, which is why the answer is a calendar, not a speech.
That calendar started on Sunday. Non-Delhi vehicles below BS-VI standards are barred, dust-generating outdoor construction is banned until 31 January, parking charges are doubled until 28 February, and offices are capped at 50% attendance2. It brought queues at the borders and grumbling online2. Rules that inconvenience people on the first day are usually the ones that are actually enforced.
What to watch
Clean air is not a gift of the weather; it is a bill the weather stops paying for you.
Sources
- Delhi air quality takes a nosedive ahead of Diwali, anti-pollution curbs kick in — Hindustan Times, 02 Nov 2026, 02:00 CET.
- Delhi AQI at 261, worst this season: New winter curbs begin with traffic snarls — The Times of India, 01 Nov 2026, 14:00 CET.
- Air Quality API: hourly PM2.5, 28.6°N 77.2°E (CAMS model) — Open-Meteo / Copernicus Atmosphere Monitoring Service, retrieved 2 Nov 2026.
Every figure in this piece traces to a source above or to the desk’s own arithmetic on those sources, marked as such. Quotations are short and attributed. Spot an error? Write to the desk; corrections are logged on the method page.
Commentary for information only. Not investment, legal, tax, medical or political advice. Not an offer or solicitation. Analysis may be incomplete or wrong. Charts show published public data, not a trading feed; binding numbers live with the institutions that publish them.