Evening edition · Thursday, 29 October 2026
October's ledger: more sun, more lignite, less gas
Four weeks of SMARD receipts show how Germany powered itself through a dear autumn. Solar rose by almost half, gas fell by an eighth, and the old brown coal took up the slack.
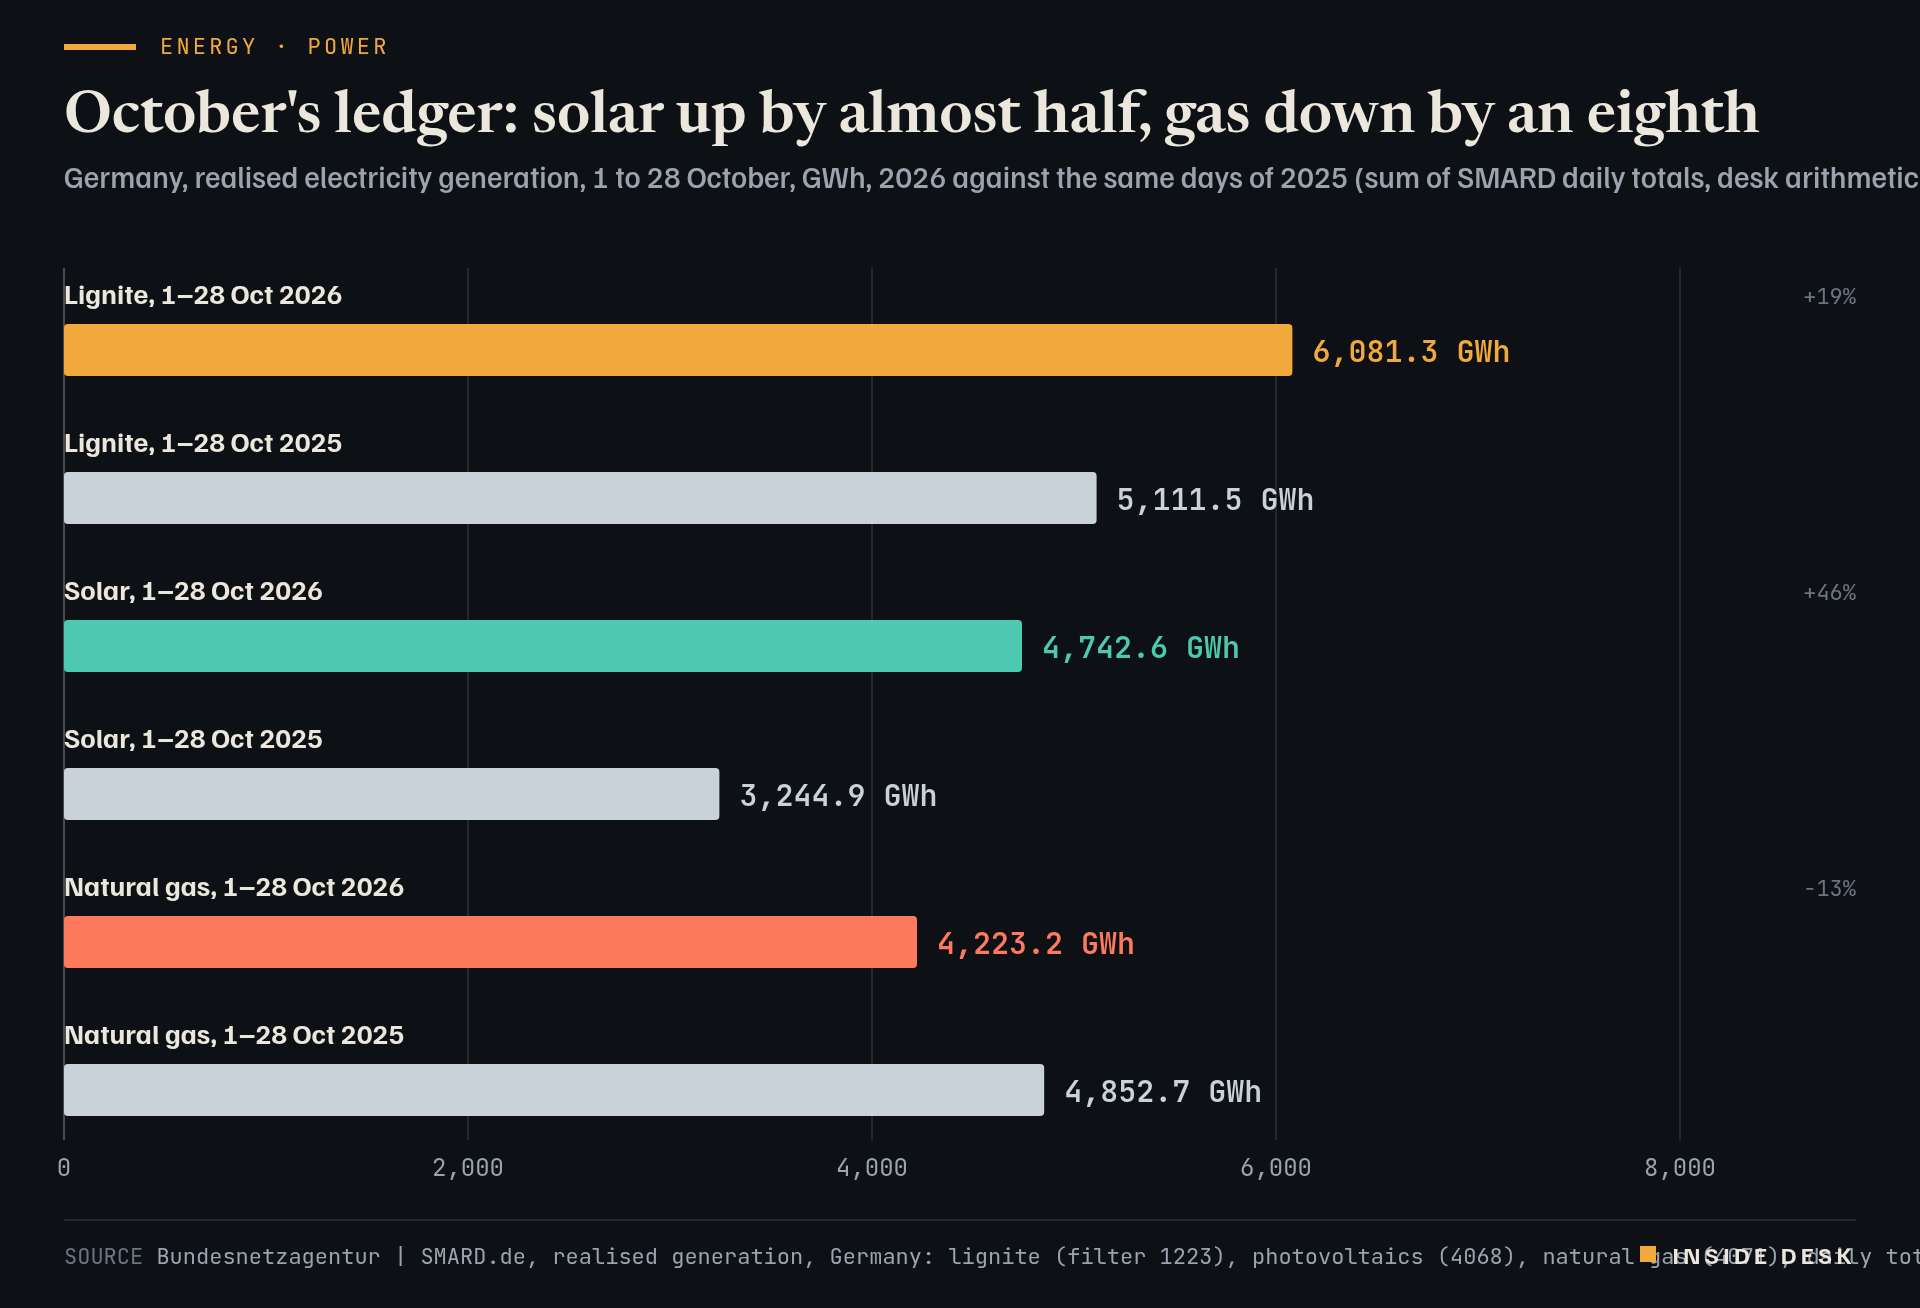
Days make headlines; months make the bill. So here is the month. Between 1 and 28 October, German solar panels generated 4,742.6 gigawatt hours of electricity, according to the Bundesnetzagentur’s SMARD figures, against 3,244.9 GWh on the same days last year1. Desk arithmetic: that is about 46% more, in a month when the sun is low and the days are short.
Bar chart of German electricity generation from 1 to 28 October, in gigawatt hours, 2026 against 2025. Lignite generated 6,081.3 GWh in 2026 against 5,111.5 GWh in 2025, up about 19%. Solar generated 4,742.6 GWh against 3,244.9 GWh, up about 46%. Natural gas generated 4,223.2 GWh against 4,852.7 GWh, down about 13%. The latest day included is Wednesday 28 October 2026.
Source Bundesnetzagentur | SMARD.de, realised generation, Germany: lignite (filter 1223), photovoltaics (4068), natural gas (4071), daily totals 1–28 Oct 2025 and 2026, retrieved 29 Oct 2026, 16:24 CET, summed and rounded to 0.1 GWh by Inside Desk · CC BY 4.0. Bundesnetzagentur | SMARD.de, market data. CC BY 4.0.
Data (CSV) · SVG · PNG

Latest values as a table
| Value | |
|---|---|
| Lignite, 1–28 Oct 2026 | 6081.3 GWh |
| Lignite, 1–28 Oct 2025 | 5111.5 GWh |
| Solar, 1–28 Oct 2026 | 4742.6 GWh |
| Solar, 1–28 Oct 2025 | 3244.9 GWh |
| Natural gas, 1–28 Oct 2026 | 4223.2 GWh |
| Natural gas, 1–28 Oct 2025 | 4852.7 GWh |
Who stepped back. Gas-fired plants generated 4,223.2 GWh over the same 28 days, against 4,852.7 GWh in 20251. Desk arithmetic: about 13% less. That fits the price of the fuel. The Dutch TTF benchmark settled at €97.35 per megawatt hour on Wednesday and is on course for a monthly rise of about 34%, Investing.com reports2. A gas plant that has to buy at those prices is often the last one anyone wants to run.
Who stepped forward. Lignite, Germany’s brown coal, generated 6,081.3 GWh, against 5,111.5 GWh a year ago1. Desk arithmetic: about 19% more. Hard coal fell slightly, to 1,889.4 GWh from 1,993.2 GWh1. Wind was mixed: onshore turbines produced 11,231.5 GWh, about 7% less than last October, and offshore farms 2,924.6 GWh, about 14% more1.
The shares. Grid load was almost the same in both years, 36,126.3 GWh this October against 36,365.3 GWh1. Desk arithmetic: wind and solar together covered about 52% of it, up from about 49%, while lignite, hard coal and gas covered about 34%, against about 33%. Both shares rose, which leaves less of the load for everything else: biomass, hydro, other plants and cross-border trade. The price was the other story: the day-ahead average was €157.82 per MWh over these days, against €84.62 a year ago1.
The calm point. There is good news and a trade-off in one table. The good news is that the solar fleet now carries real weight even in October. The trade-off is that when gas is dear, it is lignite, the most carbon-heavy fuel in the mix, that fills the gap. Neither is a verdict; both are receipts, published every morning, and you can read them yourself. Nothing here is investment advice.
What to watch
A month is a better witness than a day. It has seen the storm and the still week, and it writes both down.
Sources
- Market data: realised generation by source (lignite, photovoltaics, natural gas, wind onshore and offshore, hard coal), grid load and day-ahead price DE-LU, daily — Bundesnetzagentur / SMARD.de, retrieved 29 Oct 2026, 16:24 CET.
- European gas eases from 2022 peaks as profit-taking checks rally — Investing.com, 29 Oct 2026.
Every figure in this piece traces to a source above or to the desk’s own arithmetic on those sources, marked as such. Quotations are short and attributed. Spot an error? Write to the desk; corrections are logged on the method page.
Commentary for information only. Not investment, legal, tax, medical or political advice. Not an offer or solicitation. Analysis may be incomplete or wrong. Charts show published public data, not a trading feed; binding numbers live with the institutions that publish them.