Evening edition · Thursday, 29 October 2026
Alphabet's filing: the spending line crossed the cash line
Google's parent earned more from operations than ever and still spent $9.1 billion more cash than it took in. The share price fell on the headline; the filing explains it line by line.
On Thursday the market read Alphabet’s third-quarter results the way a headline reads: earnings per share missed, and the shares fell about 13% in early New York trading, on course for the company’s worst reaction to results since it listed in 20042. The filing behind it reads differently. It is not the story of a business that stopped working. It is the story of a business that is spending faster than it collects, and of one line below the operating profit that swung hard.
Start with what went right, because the filing does. Revenue rose 25% to $127.6 billion1. Operating income rose 30% to $40.6 billion, an operating margin of 31.8%1. Google Cloud brought in $30.7 billion, up 103% on a year earlier, and its operating income rose from $3.6 billion to $11.1 billion1. Desk arithmetic: the cloud business now keeps about 36 cents of operating profit from every dollar of revenue, against about 24 cents a year ago. “We had a strong quarter and are now on a half-trillion dollar revenue run rate,” said the chief executive, Sundar Pichai1.
So why the miss? Net income fell from $35.0 billion to $26.2 billion, and earnings per share from $2.87 to $2.121. The reason sits in one line: “other income (expense), net” moved from a gain of $12.8 billion a year ago to a loss of $8.2 billion this quarter1. Desk arithmetic: a swing of almost $21 billion, larger than the whole fall in net income. That line holds things outside the day-to-day business, and it can move a long way in either direction. If you read only the earnings-per-share headline, you read the noisiest number on the page.
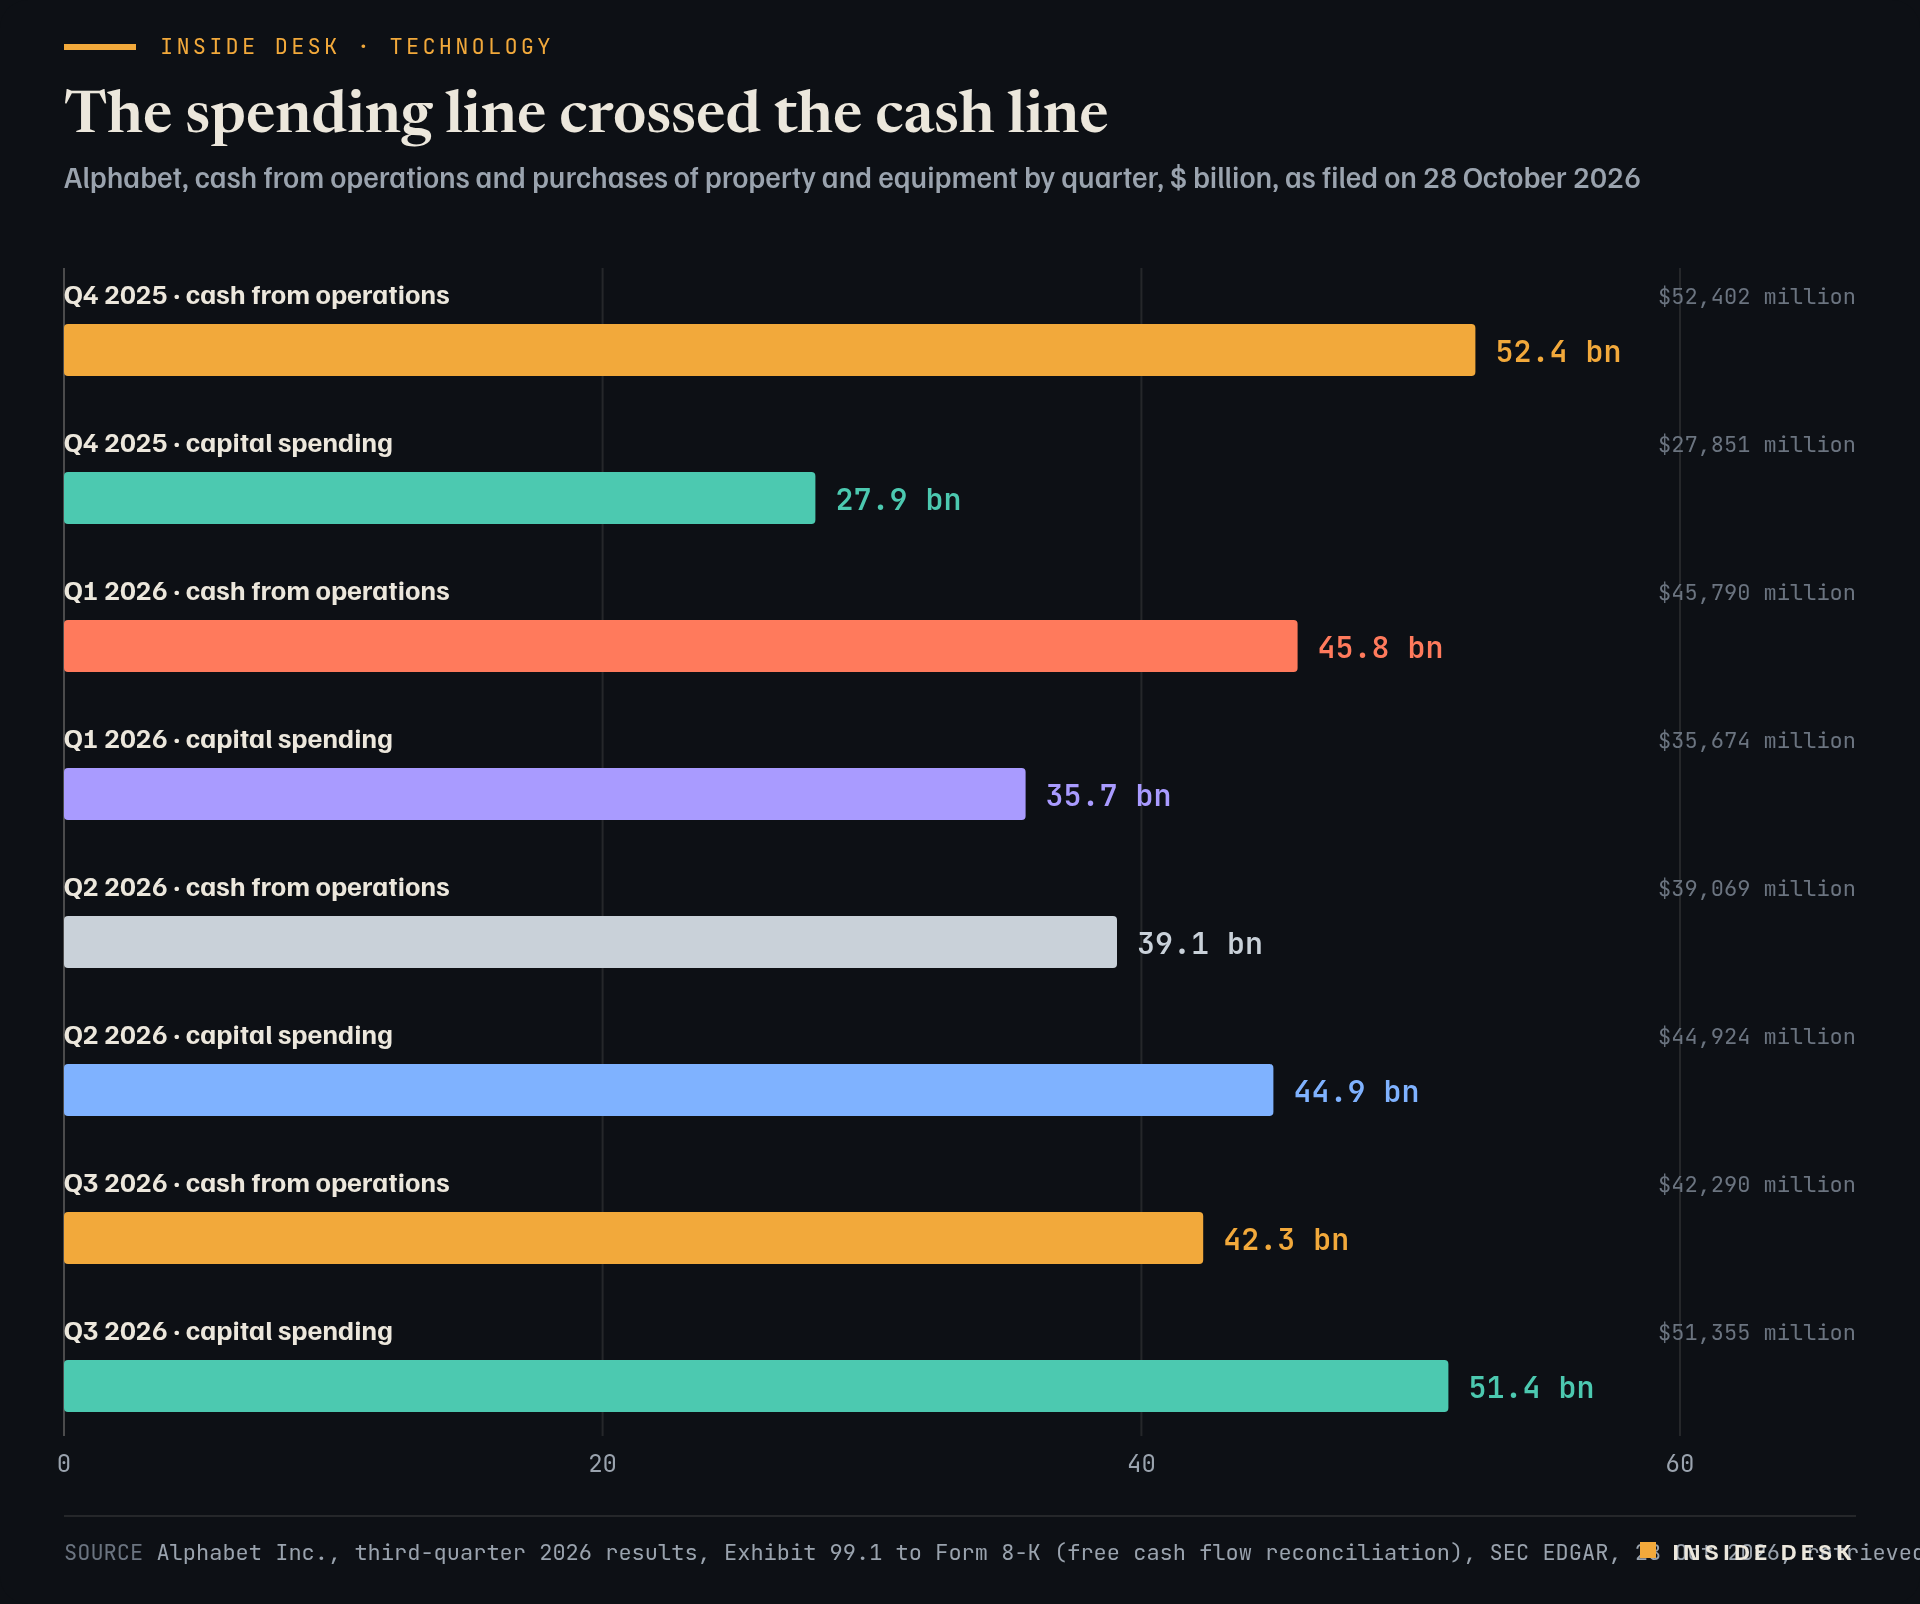
The more durable story is the cash, and the filing sets it out quarter by quarter in its own reconciliation table1:
Bar chart of Alphabet's quarterly cash from operations and capital spending. In Q4 2025 cash from operations was $52.4 billion against capital spending of $27.9 billion; in Q1 2026, $45.8 billion against $35.7 billion; in Q2 2026, $39.1 billion against $44.9 billion. In the latest quarter, Q3 2026, cash from operations was $42.3 billion and capital spending $51.4 billion, leaving free cash flow of minus $9.1 billion.
Source Alphabet Inc., third-quarter 2026 results, Exhibit 99.1 to Form 8-K (free cash flow reconciliation), SEC EDGAR, 28 Oct 2026, retrieved 29 Oct 2026. Figures rounded to $0.1 billion. Figures as reported by the named organisations; facts cited with attribution.
Data (CSV) · SVG · PNG

Latest values as a table
| Value | |
|---|---|
| Q4 2025 · cash from operations | 52.4 bn |
| Q4 2025 · capital spending | 27.9 bn |
| Q1 2026 · cash from operations | 45.8 bn |
| Q1 2026 · capital spending | 35.7 bn |
| Q2 2026 · cash from operations | 39.1 bn |
| Q2 2026 · capital spending | 44.9 bn |
| Q3 2026 · cash from operations | 42.3 bn |
| Q3 2026 · capital spending | 51.4 bn |
In the last three months of 2025, Alphabet’s operations brought in $52.4 billion and it spent $27.9 billion on property and equipment1. Since then the two lines have crossed. In the third quarter of 2026, operations brought in $42.3 billion and capital spending was $51.4 billion, leaving free cash flow of minus $9.1 billion1. Desk arithmetic: capital spending was about 121% of cash from operations, and more than twice the $24.0 billion spent in the same quarter a year earlier. Over the past twelve months free cash flow was still positive, at $19.7 billion1, but the direction is plain.
The building is not finished, and part of it is waiting on other people. Alphabet’s finance chief, Anat Ashkenazi, told analysts that outside computing power “came online only at the very end of Q3”3. Microsoft reported delays from third-party GPU providers the same evening and trimmed its own full-year spending forecast to $170 billion from $175 billion3. Alphabet kept its guidance of $195 billion to $205 billion for the year2. A quarter in which the bills for the building arrive before the rented capacity does is a quarter in which cash looks worst.
There is a payroll line too. Alphabet had 204,757 employees at the end of September, against 190,167 a year earlier1. Desk arithmetic: 14,590 more people. Whatever AI does to other companies’ headcounts, the company building it is still hiring.
What should you take from it? First, that the filing is better reading than the reaction. A company whose operating profit rose 30% did not have a bad quarter in its business. It had a quarter in which it chose to spend more than it earned, plus a large loss outside the business. Second, that cash is the honest test of the AI build-out. Revenue growth shows that customers are buying; free cash flow shows whether the seller can pay for the next round without borrowing or running down its reserves. On that test, Alphabet’s latest quarter came in below even the minus $2.7 billion analysts had expected2.
The dull parts of the filing deserve the attention. The reconciliation table, the segment profit and the employee count do not move a share price in a morning. They tell you, more reliably than any keynote, what a company is actually doing with its money. Nothing here is investment advice.
What to watch
- Amazon reports after the US close on Thursday, around 21:00 CET: the last of the big four cloud owners to show its capital spending for the quarter3.
- Alphabet has kept its full-year capital spending guidance at $195 billion to $205 billion2; the next filing will show whether the fourth quarter lands inside it.
Revenue is what you sell; cash is what you keep; capex is what you promised the future.
Sources
- Alphabet Announces Third Quarter 2026 Results (Exhibit 99.1 to Form 8-K) — Alphabet Inc. via SEC EDGAR, 28 Oct 2026, after the US close.
- Alphabet stock drops 13% while Microsoft rises after earnings — CNBC, 29 Oct 2026, 09:35 CET (updated in the afternoon).
- AI build-out hits snag as Google and Microsoft put off raising capex forecasts — CNBC, 29 Oct 2026, 12:30 CET.
Every figure in this piece traces to a source above or to the desk’s own arithmetic on those sources, marked as such. Quotations are short and attributed. Spot an error? Write to the desk; corrections are logged on the method page.
Commentary for information only. Not investment, legal, tax, medical or political advice. Not an offer or solicitation. Analysis may be incomplete or wrong. Charts show published public data, not a trading feed; binding numbers live with the institutions that publish them.