Evening edition · Thursday, 29 October 2026
Half a million heat deaths, and the two-thirds that is ours
The Lancet Countdown's tenth report counts a hotter decade. The useful number is the one the model takes away.
The Lancet Countdown on health and climate change published its tenth annual indicator report this week: 146 experts from 71 institutions, 54 indicators2. The headline everyone will quote is heat. Heat was linked to an estimated 540,800 deaths a year between 2016 and 2023, and to a record 710,000 in 2023 alone3. Desk arithmetic: from the Countdown’s own data file, the 2016–23 yearly average of 540,811 is 35.8% above the 2006–15 average of 398,3711. That is the “nearly 36% since Paris” you will read elsewhere3.
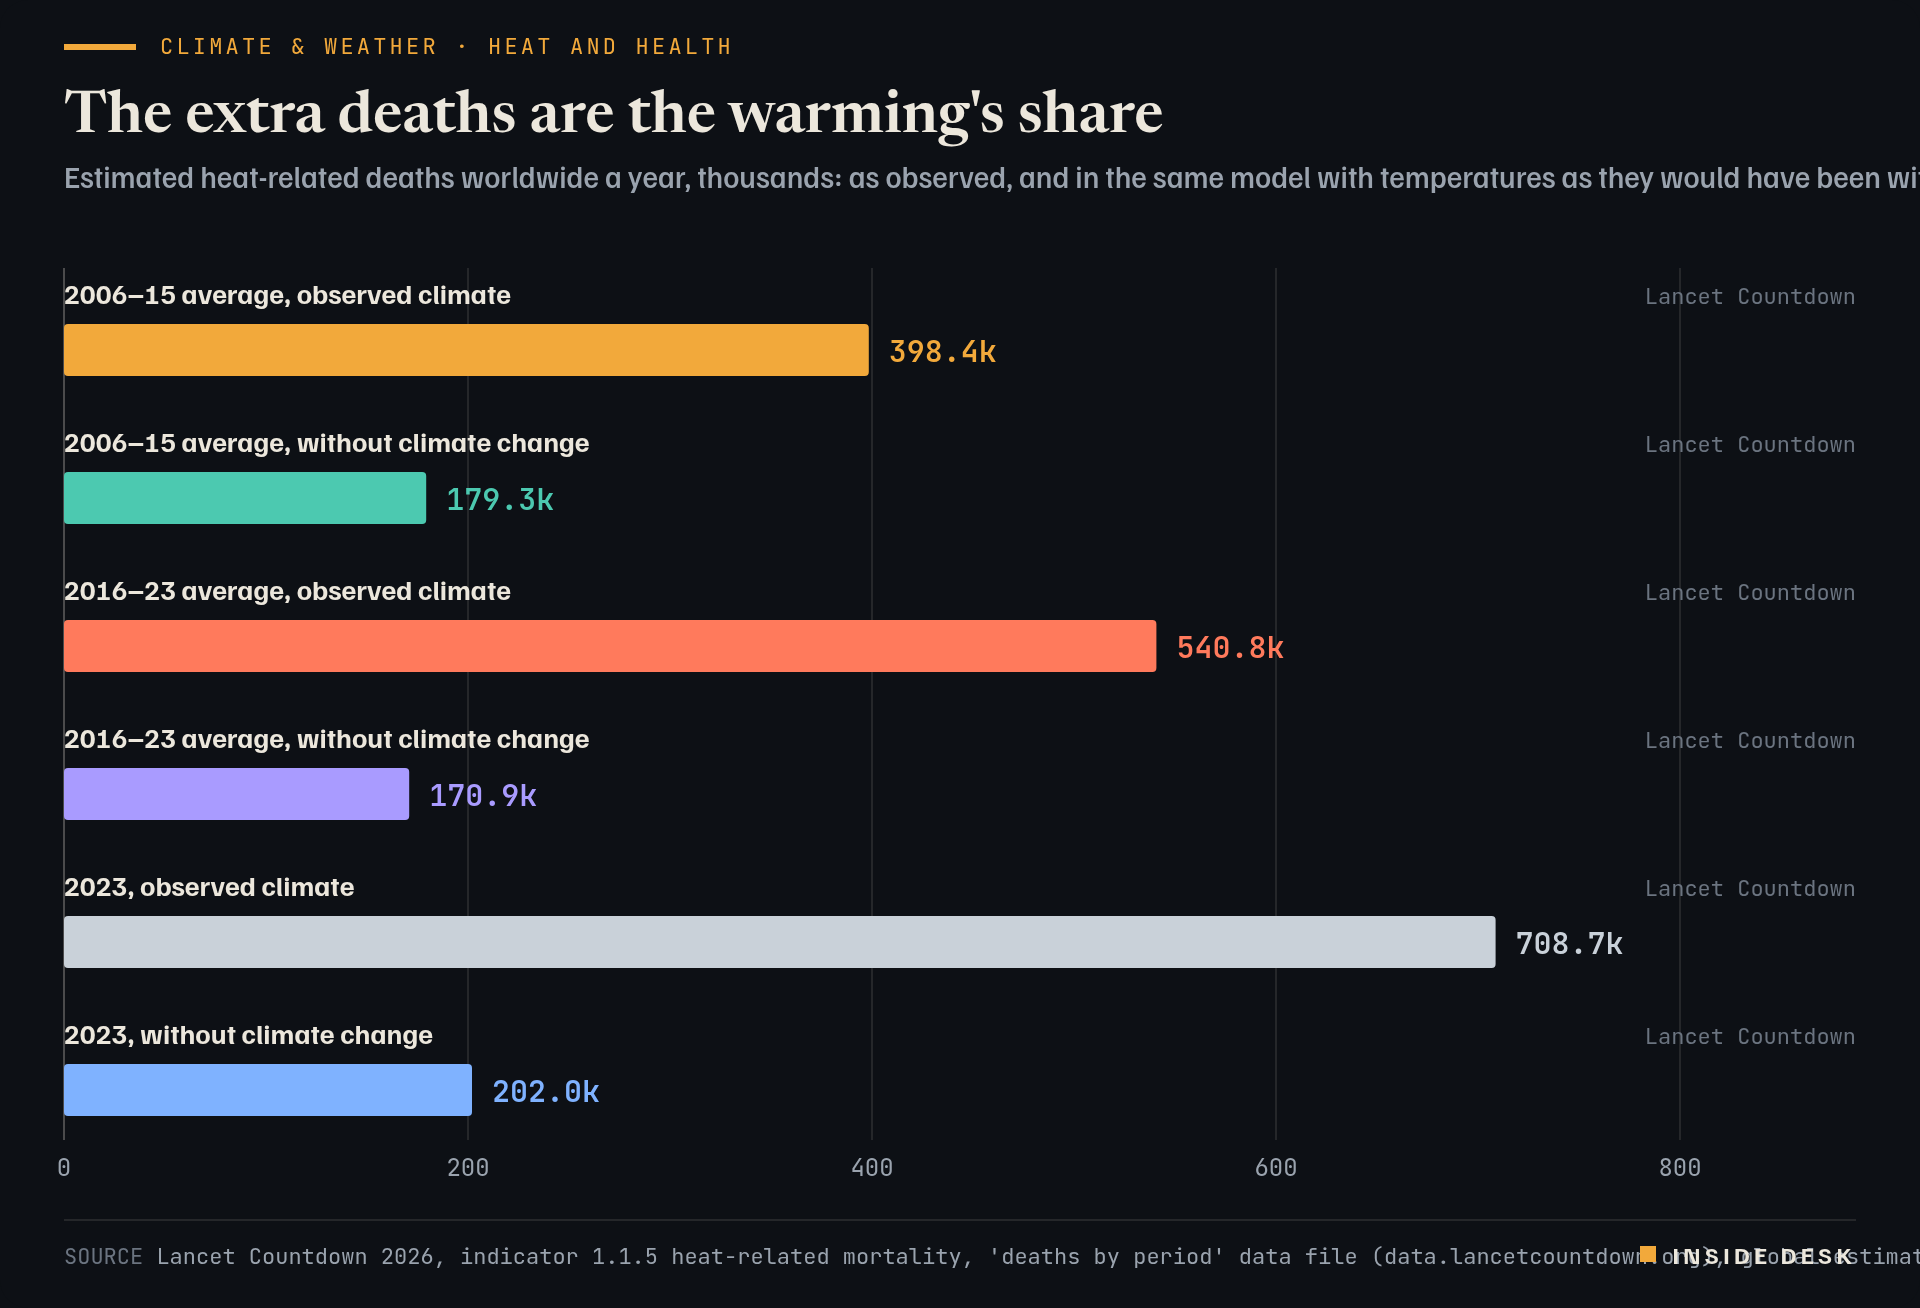
The more interesting number is the one the model subtracts. The Countdown runs the same years twice: once with the temperatures that happened, once with temperatures as they would have been without human-caused warming1. In that second world, heat deaths were about 179,260 a year in 2006–15 and 170,875 a year in 2016–231. Flat, slightly down. Desk arithmetic: the share attributed to climate change rose from about 219,100 a year to about 369,900, an increase of roughly 69%1. In 2023, 71.5% of the estimated heat deaths were attributed to climate change1.
Bar chart of estimated heat-related deaths worldwide per year, in thousands. The 2006–15 average was 398.4 thousand in the observed climate and 179.3 thousand without climate change. The 2016–23 average was 540.8 thousand observed and 170.9 thousand without climate change. In 2023, the latest year, the estimate was 708.7 thousand observed and 202.0 thousand without climate change.
Source Lancet Countdown 2026, indicator 1.1.5 heat-related mortality, 'deaths by period' data file (data.lancetcountdown.org), global estimates rounded to thousands; retrieved 29 Oct 2026 · Modelled estimates, not counted deaths; the model assumes people's sensitivity to heat does not change over time.. Figures as reported by the named organisations; facts cited with attribution.
Data (CSV) · SVG · PNG

Latest values as a table
| Value | |
|---|---|
| 2006–15 average, observed climate | 398.4k |
| 2006–15 average, without climate change | 179.3k |
| 2016–23 average, observed climate | 540.8k |
| 2016–23 average, without climate change | 170.9k |
| 2023, observed climate | 708.7k |
| 2023, without climate change | 202k |
Two cautions keep this honest. These are modelled estimates built on mortality data from 129 countries, not a count of death certificates1. And the model assumes that people’s sensitivity to heat does not change over time; the authors say that if adaptation is working, later years may be overestimated1. That caveat is the good news hiding in the footnotes: shade, cooling centres, early warnings and checking on an elderly neighbour are exactly the kind of adaptation that would make the next estimate smaller.
The report is not only gloom. Clean-energy investment reached a record $2.1 trillion in 2025, even as fossil fuels still supply more than 80% of the world’s energy3. Health harms “are growing faster than the world’s response to them”, said Marina Romanello, the Countdown’s executive director3. The authors want climate change formally recognised as a global health emergency2.
For you, the practical part is unglamorous. The Countdown names older adults, women and people with underlying health conditions as particularly vulnerable to heat1. A heat plan is a phone list, a thermometer and a cool room. It works in any decade.
What to watch
A hotter year is weather; a hotter decade is a bill, and bills can be paid down.
Sources
- Heat-Related Mortality (indicator 1.1.5) and data files — Lancet Countdown, indicator updated Sep 2026; retrieved 29 Oct 2026, 16:20 CET.
- The 2026 Global Report of the Lancet Countdown — Lancet Countdown, 28 Oct 2026.
- Heat-related deaths up nearly 36% since Paris Agreement, Lancet report finds (Morning Medical Update) — Medical Economics, 29 Oct 2026, 10:05 CET.
Every figure in this piece traces to a source above or to the desk’s own arithmetic on those sources, marked as such. Quotations are short and attributed. Spot an error? Write to the desk; corrections are logged on the method page.
Commentary for information only. Not investment, legal, tax, medical or political advice. Not an offer or solicitation. Analysis may be incomplete or wrong. Charts show published public data, not a trading feed; binding numbers live with the institutions that publish them.