Morning edition · Thursday, 29 October 2026
€314.85 for today, and Wednesday's receipts explain it
Germany's day-ahead power price has climbed four days running, to the dearest daily average of the year. SMARD's figures for Wednesday show why: the wind fell to a fifth of Sunday's, and gas and coal did the rest.
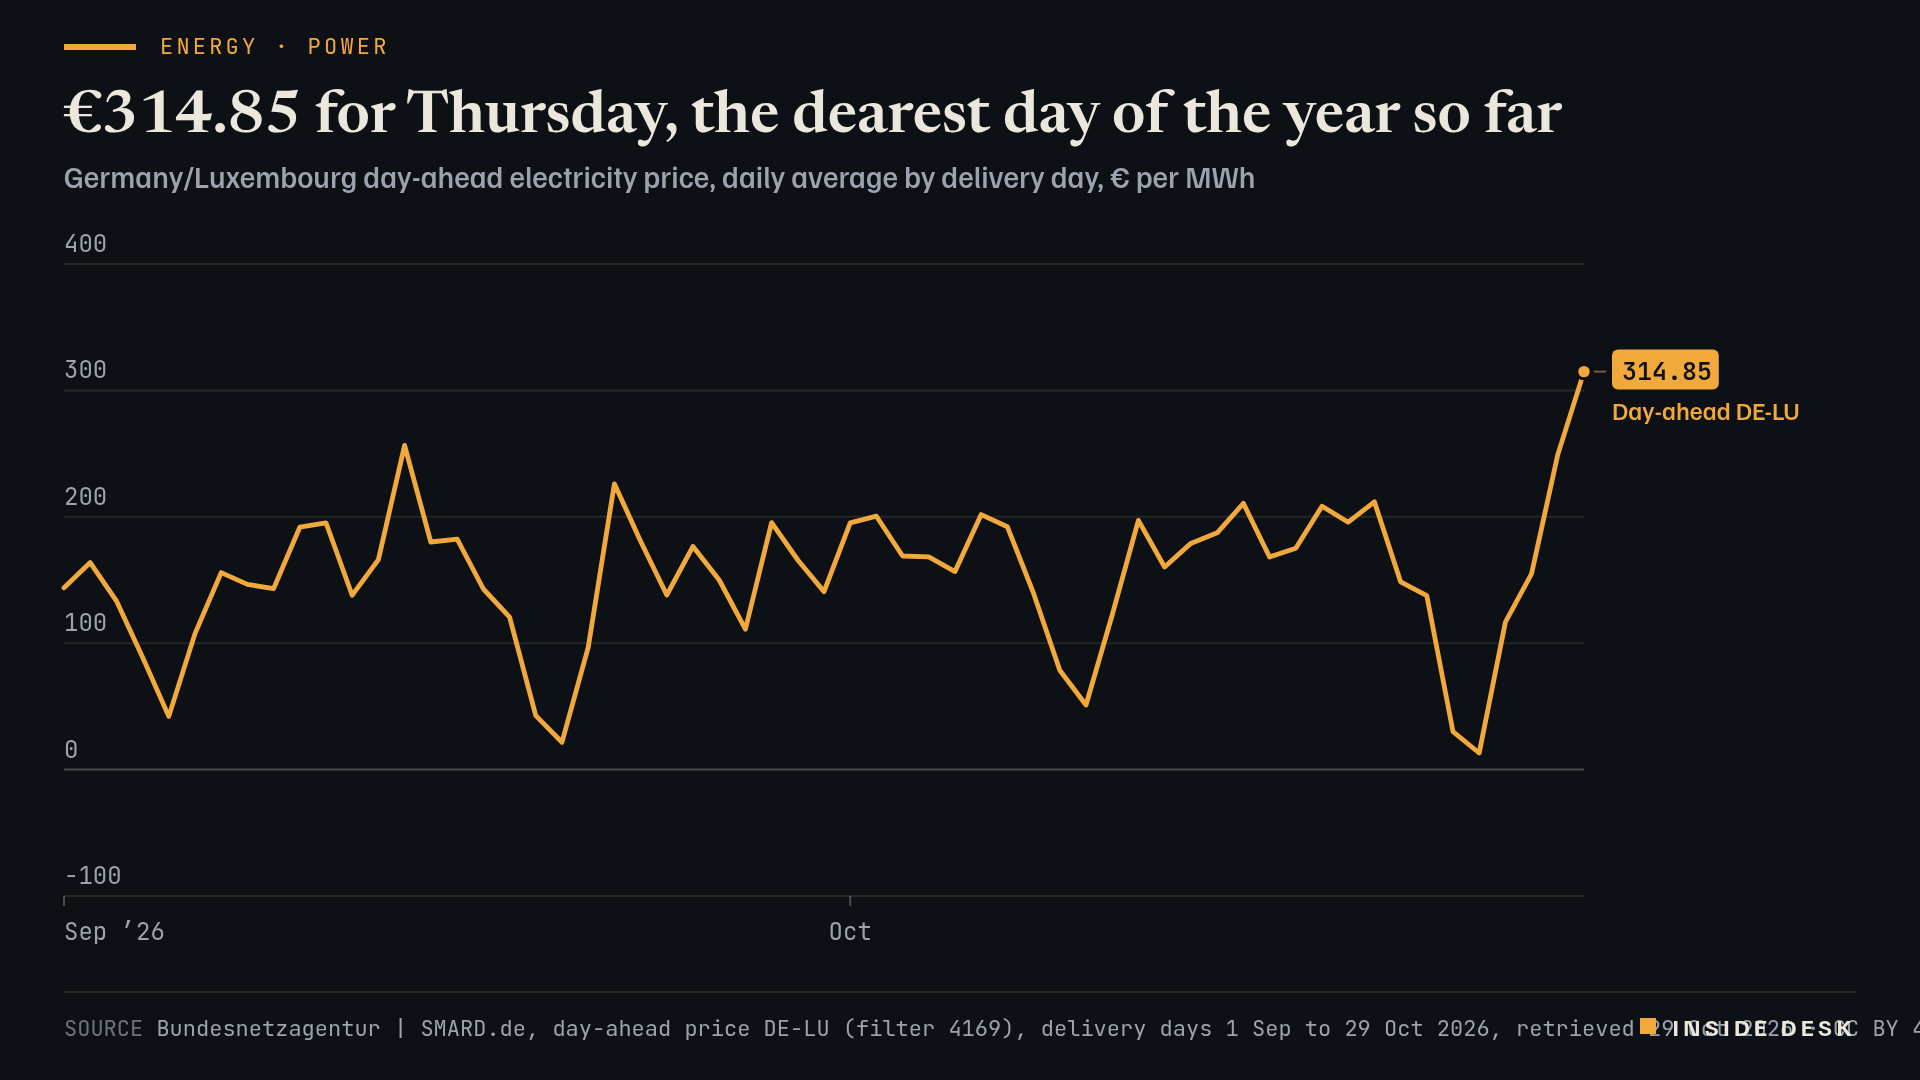
The German-Luxembourg day-ahead price for delivery today, Thursday 29 October, averages €314.85 per megawatt hour, according to SMARD, the Bundesnetzagentur’s data portal1. That is the highest daily average of 2026 so far, above the €256.55 of 14 September1. On Sunday 25 October, in the storm, it was €13.121. Desk arithmetic: today’s power costs about 24 times Sunday’s, and the price has risen on each of the four days since.
Line chart of the daily average German-Luxembourg day-ahead electricity price from 1 September to 29 October 2026, in euros per megawatt hour. It peaks at €256.55 on 14 September, falls to €30.12 on Saturday 24 October and €13.12 on Sunday 25 October during the storm, then climbs on four straight days to €116.57 on 26 October, €155.11 on 27 October and €249.21 on 28 October. The latest value is €314.85 for delivery on Thursday 29 October, the highest daily average of 2026 so far.
Source Bundesnetzagentur | SMARD.de, day-ahead price DE-LU (filter 4169), delivery days 1 Sep to 29 Oct 2026, retrieved 29 Oct 2026 · CC BY 4.0. Bundesnetzagentur | SMARD.de, market data. CC BY 4.0.
Data (CSV) · SVG · PNG

Latest values as a table
| Date | Day-ahead DE-LU |
|---|---|
| 2026-10-24 | 30.12 |
| 2026-10-25 | 13.12 |
| 2026-10-26 | 116.57 |
| 2026-10-27 | 155.11 |
| 2026-10-28 | 249.21 |
| 2026-10-29 | 314.85 |
Wednesday’s receipts. This morning SMARD added what the plants actually did yesterday1. Onshore wind generated 210,929 megawatt hours on Wednesday, against 1,019,966 MWh on Sunday1. Offshore farms added 106,567 MWh1. Desk arithmetic: onshore output was about a fifth of Sunday’s, and wind as a whole covered about 23% of Wednesday’s grid load of 1,383,280 MWh1. Solar, in late October, added 102,699 MWh1.
Who filled the gap. Gas-fired plants generated 241,979 MWh on Wednesday, against 43,542 MWh on Sunday1. Lignite produced 267,508 MWh and hard coal 79,562 MWh1. Desk arithmetic: gas output rose about 5.6 times in three days, and gas, lignite and hard coal together covered about 43% of the load. That matters for your bill because the last plant needed in an hour tends to set that hour’s price, and the gas it burns has rarely been dearer. The front-month Dutch TTF contract, Europe’s gas benchmark, briefly touched €100 per MWh on Wednesday afternoon for the first time since December 2022, RTÉ reports, citing ICE data2.
The shape of today. The hourly prices are a timetable1. The cheapest hours are in the night, with a low of €231.00 between 02:00 and 03:00 CET. The dearest is 17:00 to 18:00 CET, at €559.631. Desk arithmetic: that evening hour costs about 56 cents per kilowatt hour on the wholesale market, before network charges, taxes and levies. If you are on a dynamic tariff, the dishwasher has a better evening after 21:00 than before. If you are on a fixed tariff, your supplier bought most of today’s power long ago, and this auction reaches you slowly and averaged out2.
The calm point. A still week in late autumn is not a crisis of the grid. The lights stayed on, and the old plants came back exactly as they are paid to. What the price records is the value of every megawatt hour that could have been stored on Sunday and sold today. That spread is public, on a government website, every morning. Nothing here is investment advice.
What to watch
The dearest hour of the day is a timetable, not a verdict. Read it before you switch on the oven.
Sources
- Market data: day-ahead price DE-LU (daily and hourly); realised generation by source; grid load — Bundesnetzagentur / SMARD.de, retrieved 29 Oct 2026, 05:20 CET.
- European benchmark gas price hits €100 per MWh for first time since 2022 — RTÉ, 28 Oct 2026, 17:16 CET.
Every figure in this piece traces to a source above or to the desk’s own arithmetic on those sources, marked as such. Quotations are short and attributed. Spot an error? Write to the desk; corrections are logged on the method page.
Commentary for information only. Not investment, legal, tax, medical or political advice. Not an offer or solicitation. Analysis may be incomplete or wrong. Charts show published public data, not a trading feed; binding numbers live with the institutions that publish them.