Evening edition · Wednesday, 28 October 2026
107 millimetres of rain, 1.8 points of reservoir
Storms have pushed Sussex's October rainfall well past normal. Ardingly reservoir is still under a fifth full, because dry ground drinks first and the reservoir gets what is left.
Storms that blow over Sussex make the news. A reservoir that drains slowly does not. This week the two met, and the storms lost.
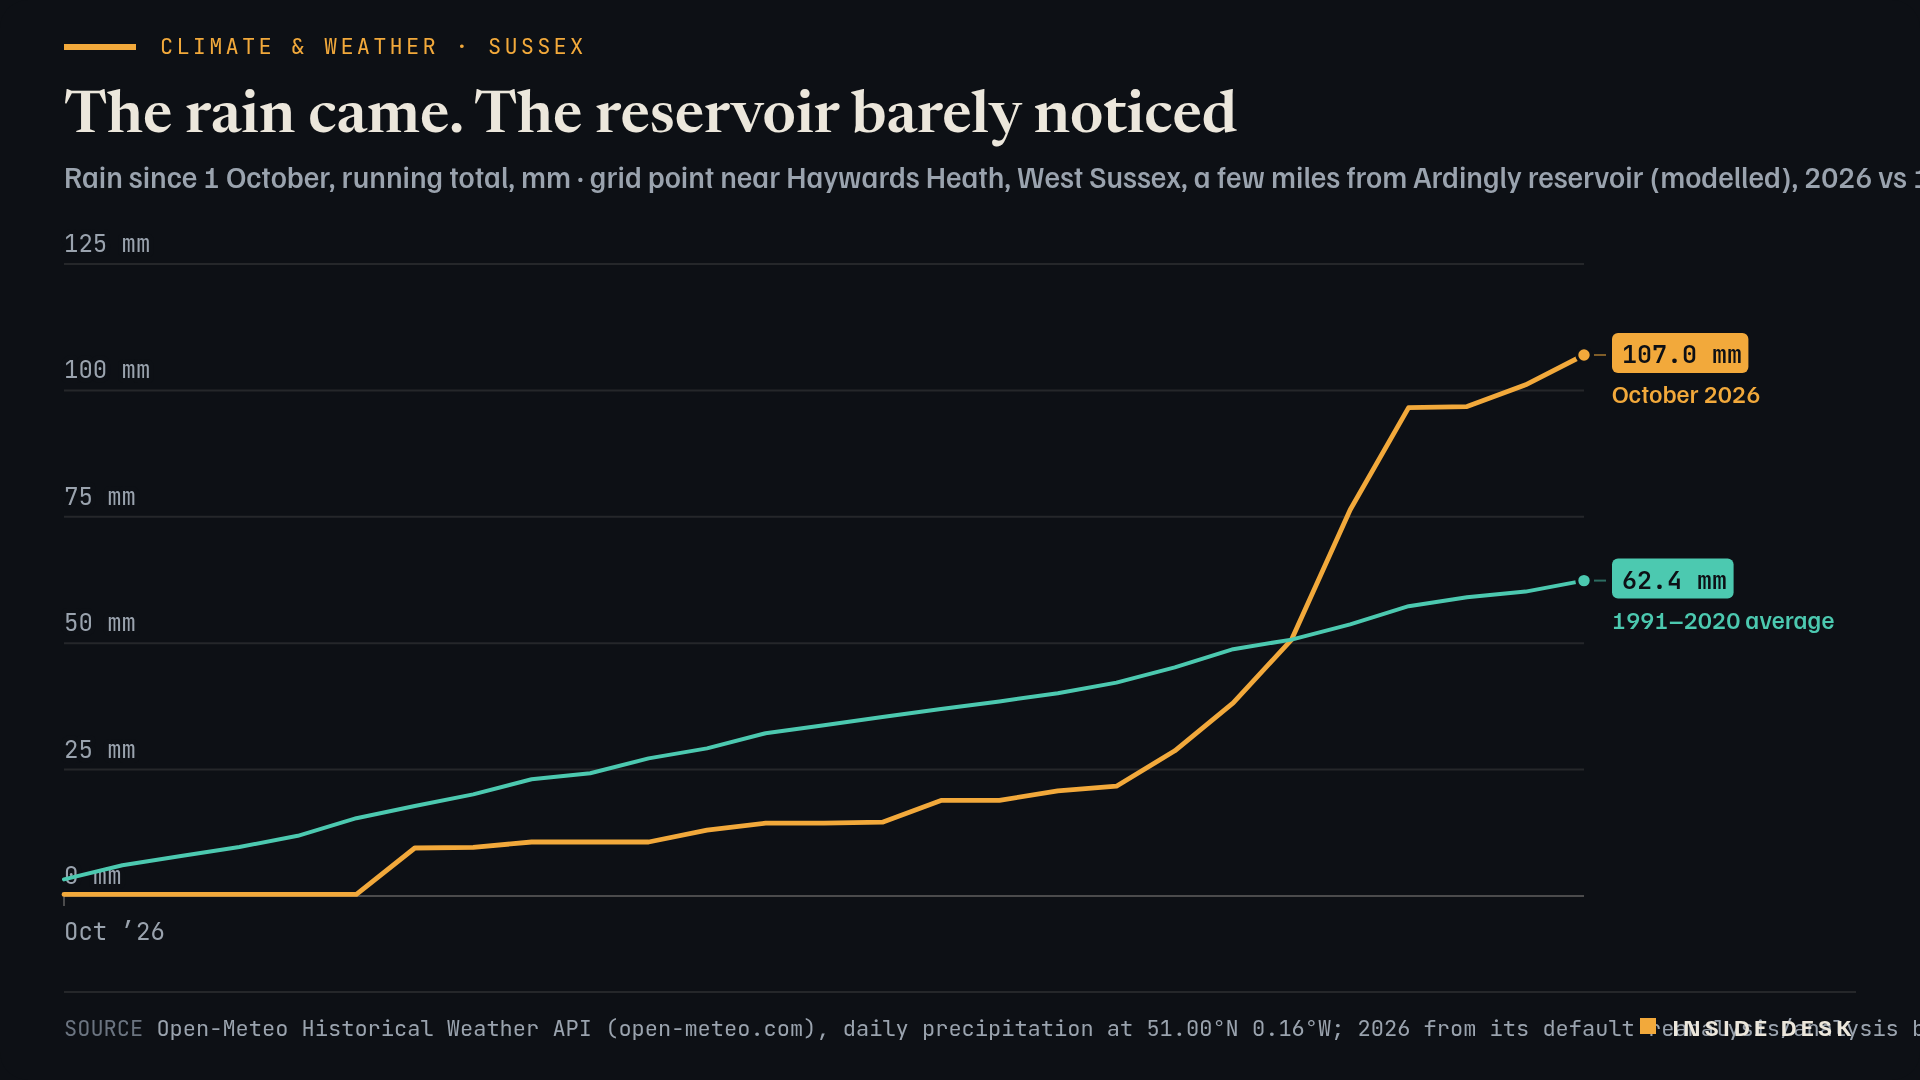
At a modelled grid point near Haywards Heath, a few miles from Ardingly reservoir, only 21.7 mm of rain fell between 1 and 19 October4. Then the storms came, and by Tuesday 27 October the month’s total was 107.0 mm, against a 1991–2020 average of 62.4 mm for the same days4. Desk arithmetic: about 171 per cent of normal, and most of it fell in five days.
Line chart of modelled rainfall at a grid point near Haywards Heath in West Sussex, running total from 1 October. In 2026 almost nothing falls in the first six days, the total reaches only 21.7 mm by 19 October, then storms from 20 to 24 October lift it to 96.6 mm, and it reaches 107.0 mm on Tuesday 27 October 2026, the latest value. The 1991–2020 average for the same days rises steadily to 62.4 mm by 27 October; the 2026 line overtakes it on 23 October.
Source Open-Meteo Historical Weather API (open-meteo.com), daily precipitation at 51.00°N 0.16°W; 2026 from its default reanalysis/analysis blend, 1991–2020 average from ERA5 (Copernicus/ECMWF); desk running totals; retrieved 28 Oct 2026 · Open-Meteo data CC BY 4.0. Modelled grid values, not station readings.. Figures as reported by the named organisations; facts cited with attribution.
Data (CSV) · SVG · PNG

Latest values as a table
| Date | October 2026 | 1991–2020 average |
|---|---|---|
| 2026-10-22 | 50.7 | 50.7 |
| 2026-10-23 | 76.4 | 53.7 |
| 2026-10-24 | 96.6 | 57.3 |
| 2026-10-25 | 96.8 | 59.1 |
| 2026-10-26 | 101.1 | 60.2 |
| 2026-10-27 | 107 | 62.4 |
Now look at the reservoir. On Sunday 25 October South East Water put Ardingly at 18.8 per cent full2, a rise of 1.8 points after Storms Austen and Boelo3. The rain did not go missing. The Environment Agency explains where it went: soils have to be saturated before rainfall can recharge resources, and soils across much of England are still drier than normal for the time of year1. The ground gets paid first. The reservoir gets what is left.
That is why the Agency’s weekly report reads like a careful set of accounts, not a weather bulletin. As of 22 October, England had received 52 per cent of its average October rainfall, national reservoir storage stood at 54 per cent of capacity, about 22 per cent below normal for the time of year, and 13 reservoirs or groups were classed as exceptionally low, Ardingly among them1. Parts of Cornwall, Devon, Dorset, Somerset, East Sussex and West Sussex have been in severe drought since 15 October1. South East Water’s head of water resources, Nick Price, said the rain had “helped maintain river flows”, and he warned that forecasts point to drier days again3.
The useful thing about the dull machinery is that it is already running. Drought permits, temporary use bans and weekly reports keep turning whatever the weather does1. If you live in the south of England, the details of any ban in your area are on your water company’s website1. A wet week is welcome, but it does not end a drought.
What to watch
- The National Drought Group was scheduled to meet on 28 October; look for what it agreed in the Environment Agency's next weekly drought summary1.
- The official reservoir refill season for farm abstractors starts on 1 November, and the Agency said it would publish its farm-reservoir refill outlook this week1.
A storm is an event. A drought is a balance sheet.
Sources
- Dry weather and drought in England: 16 to 22 October 2026 — Environment Agency (GOV.UK), 23 Oct 2026.
- Reservoir levels — South East Water, levels as of 25 Oct 2026, retrieved 28 Oct 2026, 16:20 CET.
- Storms bring slight lift to Ardingly Reservoir as winter drought threat looms — Sussex Express, 28 Oct 2026, 10:54 CET.
- Historical Weather API, daily precipitation at 51.00°N 0.16°W — Open-Meteo (ERA5, Copernicus/ECMWF), retrieved 28 Oct 2026, 16:28 CET.
Every figure in this piece traces to a source above or to the desk’s own arithmetic on those sources, marked as such. Quotations are short and attributed. Spot an error? Write to the desk; corrections are logged on the method page.
Commentary for information only. Not investment, legal, tax, medical or political advice. Not an offer or solicitation. Analysis may be incomplete or wrong. Charts show published public data, not a trading feed; binding numbers live with the institutions that publish them.