Evening edition · Tuesday, 27 October 2026
Five Indian states have now declared drought, and the rain gauge tells you when it stopped
Rajasthan and Gujarat joined Karnataka, Maharashtra and Andhra Pradesh. The relief comes as cattle camps and paused loan collections, the unglamorous kind.
India’s drought map grew on Tuesday. Rajasthan has declared drought in 80 tehsils (sub-districts) across 14 districts, and Gujarat in four districts: Kutch, Devbhumi Dwarka, Jamnagar and Porbandar1. They follow Karnataka, Maharashtra and Andhra Pradesh1. Karnataka’s government says its latest estimates put 80% of the kharif crop, the monsoon-season harvest, as destroyed1.
In Rajasthan, Jodhpur has the most drought-hit tehsils at 12, followed by Barmer and Jalore with 10 each1. Of the 80, 69 are classed as severely and 11 as moderately hit1. Bajra, jowar, moong, moth beans and sesame have been lost, and Jodhpur’s water storage stood at 15.15% on 16 October1.
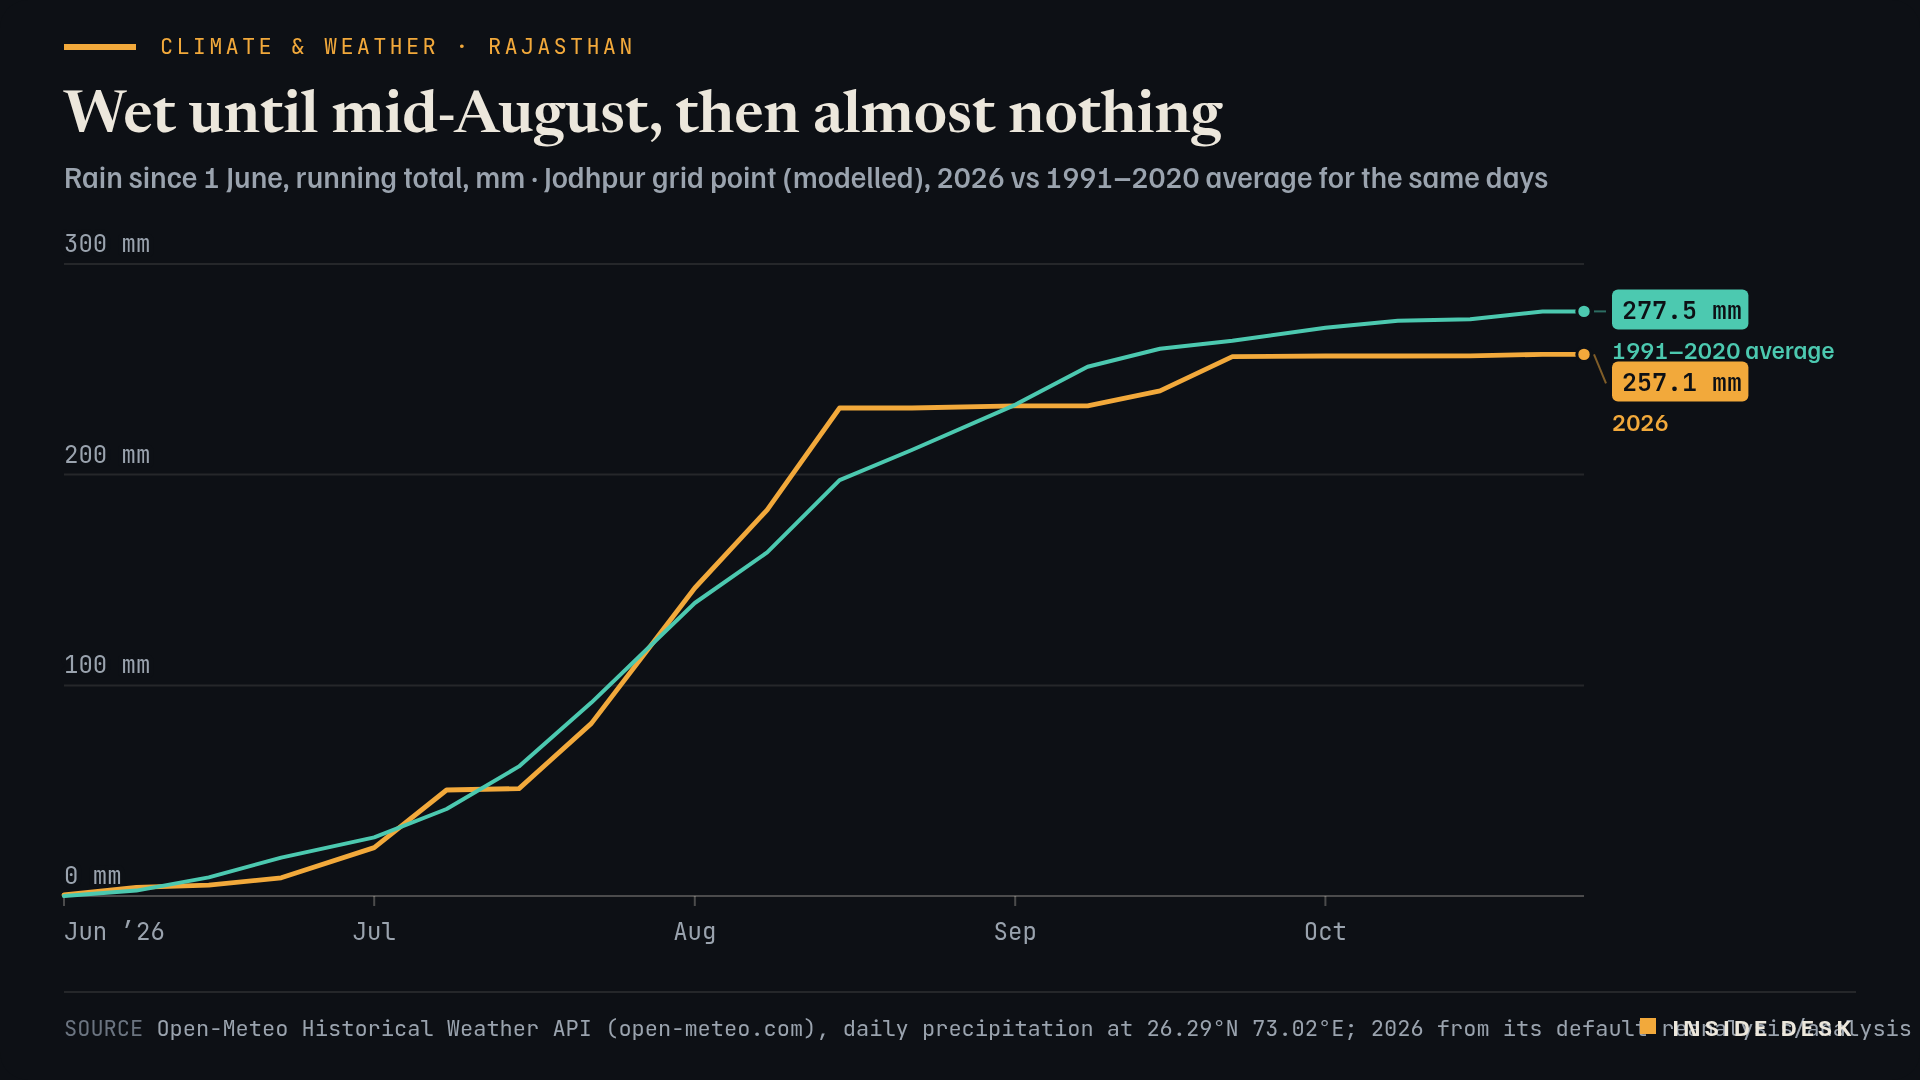
Line chart of modelled rainfall at a Jodhpur grid point, running total from 1 June. In 2026 the total runs slightly below the 1991–2020 average through July, pulls ahead in early August to 231.6 mm by 15 August, then adds only 25.5 mm more, ending at 257.1 mm on Monday 26 October 2026, the latest value. The 1991–2020 average for the same days keeps climbing to 277.5 mm by 26 October.
Source Open-Meteo Historical Weather API (open-meteo.com), daily precipitation at 26.29°N 73.02°E; 2026 from its default reanalysis/analysis blend, 1991–2020 average from ERA5 (Copernicus/ECMWF); desk running totals at weekly points; retrieved 27 Oct 2026 · Open-Meteo data CC BY 4.0. Modelled grid values for one point, not station readings or a district average.. Figures as reported by the named organisations; facts cited with attribution.
Data (CSV) · SVG · PNG

Latest values as a table
| Date | 2026 | 1991–2020 average |
|---|---|---|
| 2026-09-22 | 256 | 263.5 |
| 2026-10-01 | 256.3 | 269.7 |
| 2026-10-08 | 256.3 | 273 |
| 2026-10-15 | 256.4 | 273.8 |
| 2026-10-22 | 257.1 | 277.4 |
| 2026-10-26 | 257.1 | 277.5 |
The season total alone would not tell you this. A modelled grid point over Jodhpur shows 257.1 mm of rain since 1 June, against a 1991–2020 average of 277.5 mm for the same days2. Desk arithmetic: about 7% short, hardly a catastrophe on paper. The shape is the story. By 15 August the grid point was ahead of normal at 231.6 mm; from 16 August to 26 October it recorded 25.5 mm, against an average of 80.1 mm2. Desk arithmetic: about a third of the usual late-season rain. One grid point is not a district, and model grids smooth out local storms, so read it as a shape, not a measurement.
What a declaration buys is dull and useful. Rajasthan has announced cattle camps in affected areas and a six-month suspension of farm-loan recovery1. Gujarat says it has been selling fodder at cheaper rates since July1. None of that makes rain. It does stop a bad season from turning into a forced sale of the herd or a defaulted loan, which is how one dry autumn becomes three poor years.
If you buy Indian rice, pulses or spices, nothing in Tuesday’s reports puts a number on prices, and the desk will not invent one. The quieter point is for anyone who thinks of climate as an averages problem: farms live on timing, and a month’s rain arriving early is not the same as a month’s rain.
What to watch
A drought is declared on paper so that the fodder can arrive by lorry.
Sources
- Rajasthan, Gujarat declare drought after Maharashtra, Karnataka and Andhra Pradesh — CNBC-TV18, 27 Oct 2026, 02:16 CET.
- Historical Weather API, daily precipitation, 26.29°N 73.02°E — Open-Meteo (ERA5, Copernicus/ECMWF), retrieved 27 Oct 2026, 16:32 CET.
Every figure in this piece traces to a source above or to the desk’s own arithmetic on those sources, marked as such. Quotations are short and attributed. Spot an error? Write to the desk; corrections are logged on the method page.
Commentary for information only. Not investment, legal, tax, medical or political advice. Not an offer or solicitation. Analysis may be incomplete or wrong. Charts show published public data, not a trading feed; binding numbers live with the institutions that publish them.