Sunday long-read · Sunday, 8 November 2026
The Sunday Sequence: a ballot, a bounce, a correction and a jobs report, in that order
The S&P 500 lost 2.68% on the week, its worst since April 2025. The total hides the order: Wednesday's best day in three months came before Thursday's worst in 19.
On Sundays this desk puts the week back in the order it happened. This one needs it more than most, because the total, a 2.68% fall in the S&P 5005, describes no single day anyone lived through.
Monday: oil first. Brent fell 7.63% to $104.77 on hopes of US-Iran talks, and airlines rose1. The Dow gained 0.41% to 51,983.98, but the S&P 500 lost 0.51% to 7,541.40 and the Nasdaq 1.07%, as Oracle said it would raise $20 billion for data centres and its shares fell 8%1. The first crack of the week was a funding plan, not a vote.
Tuesday: the ballot. Americans voted. The S&P 500 and Nasdaq snapped three-session losing streaks while the Dow finished slightly lower2. Futures fell after hours as results came in2.
Wednesday: the relief. Democrats took both chambers, and the Dow jumped 1,569 points, or 3%, its fifth-largest one-day points gain; the S&P 500 rose 1.6%2. “Markets like gridlock,” said Andrew Slimmon of Morgan Stanley Investment Management2. But the same page carried the warning: Goldman Sachs said Democratic state wins made data-centre moratoriums more likely, potentially affecting about 45% of planned US capacity2. Nvidia fell 3% on the best day2.
Thursday: the bill for the relief. The Nasdaq fell 5.52% to 24,315.00, its deepest drop in 19 months, confirming a correction; the S&P 500 lost 4.36%3. The semiconductor index plunged more than 12%, and Reuters counted $3 trillion of S&P 500 value gone3. Volume was 26.9 billion shares against a 20-session average of 17.7 billion3. That is what a crowded exit sounds like.
Friday: the payslip. Payrolls beat expectations and unemployment fell to 4.1%4. Chips bounced 4.2%, AMD 11%, the S&P 500 0.32% to 7,376.864. Traders lifted the odds of a December Fed hike to 78%4. “AI has gone on trial several times in this cycle and come away with an innocent verdict,” said LPL Financial’s Adam Turnquist4. The jury, note, is still sitting.
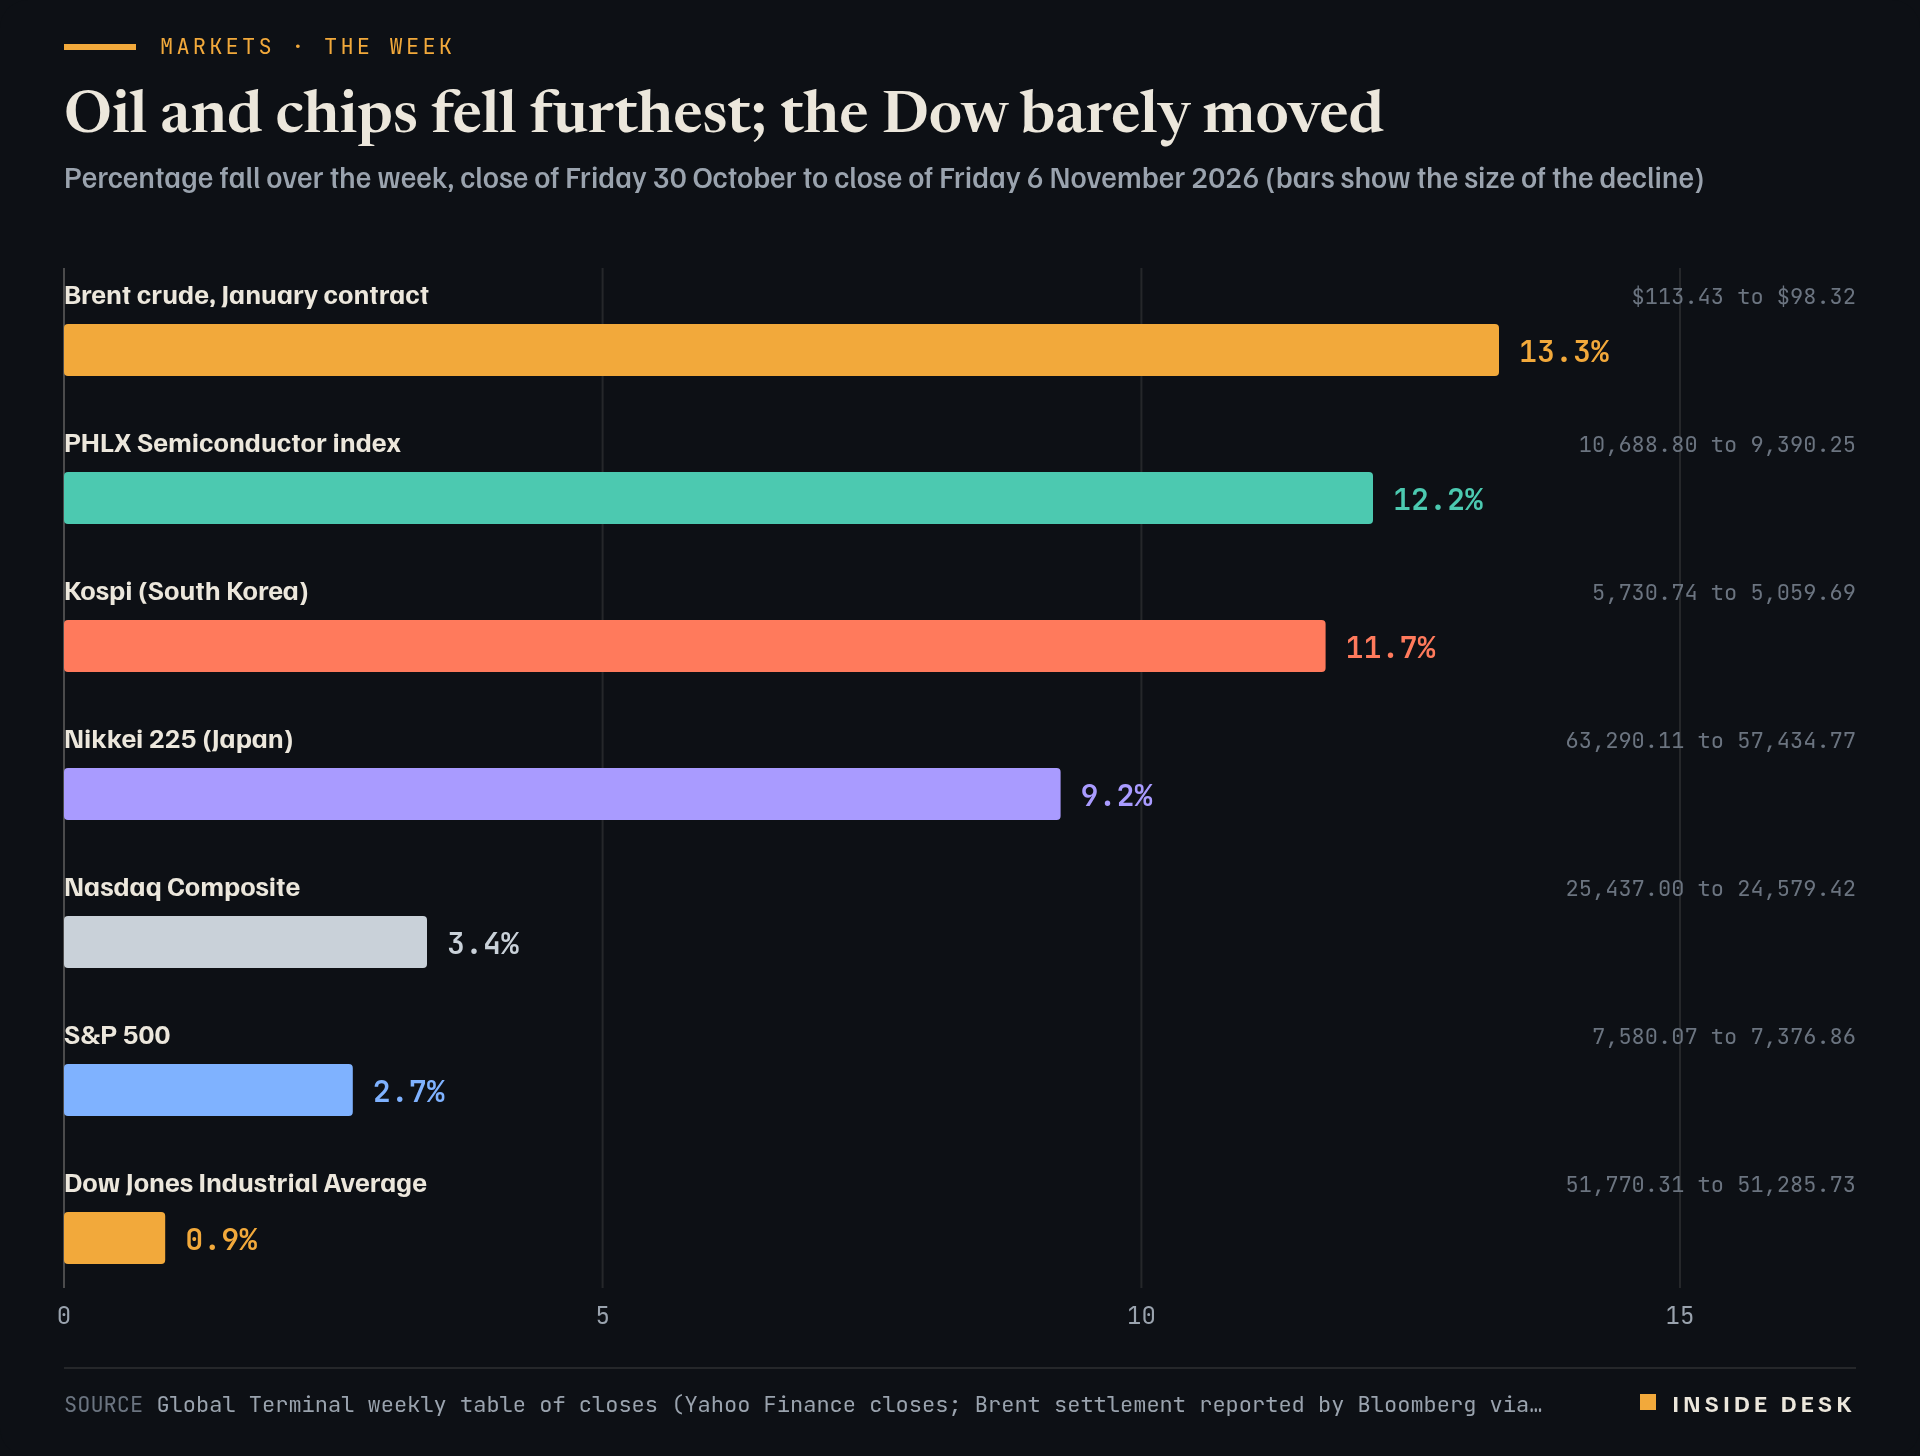
Bar chart of weekly percentage falls from 30 October to 6 November 2026: Brent crude 13.32 percent, PHLX Semiconductor index 12.15 percent, Kospi 11.71 percent, Nikkei 225 9.25 percent, Nasdaq Composite 3.37 percent, S&P 500 2.68 percent and Dow Jones Industrial Average 0.94 percent. Over the same week Hong Kong's Hang Seng rose 5.10 percent and the Stoxx Europe 600 0.24 percent.
Source Global Terminal weekly table of closes (Yahoo Finance closes; Brent settlement reported by Bloomberg via Rigzone), 'Markets This Week', 6 Nov 2026; S&P 500 weekly fall confirmed by Dow Jones Market Data via Morningstar; retrieved 8 Nov 2026 · reported figures. Figures as reported by the named organisations; facts cited with attribution.
Data (CSV) · SVG · PNG

Latest values as a table
| Value | |
|---|---|
| Brent crude, January contract | 13.32% |
| PHLX Semiconductor index | 12.15% |
| Kospi (South Korea) | 11.71% |
| Nikkei 225 (Japan) | 9.25% |
| Nasdaq Composite | 3.37% |
| S&P 500 | 2.68% |
| Dow Jones Industrial Average | 0.94% |
The total. The S&P 500 is down four weeks in a row, 5.56% over the stretch, and 5.65% below its 6 October record5. Yet it is still up 7.76% this year5. Abroad the week split cleanly: the Kospi lost 11.71% and the Nikkei 9.25%, while Hong Kong’s Hang Seng gained 5.10% and the Stoxx Europe 600 0.24%6. The selling was about one industry’s building plans, not about the world.
Nothing here is investment advice.
What to watch
A week is five verdicts, not one. Read them in order and the market looks less mad and more busy.
Sources
- [New York Stock Market] Mixed Close a Day Before Election as Oil Plunges and Tech Stocks Sell Off — The Asia Business Daily, 2 Nov 2026, 22:49 CET.
- Markets News, Nov. 4, 2026: Dow Jumps Nearly 1,600 Points as Stocks Soar After Democrats' Decisive Win in Midterms — Investopedia, 4 Nov 2026, 22:53 CET.
- Nasdaq posts biggest daily drop in 19 months on fears of AI regulations — Reuters via Investing.com, 5 Nov 2026.
- Nasdaq rebounds but posts fourth straight weekly decline — Reuters via StreetInsider, 6 Nov 2026.
- S&P 500 Falls 2.68% This Week to 7376.86 — Data Talk — Dow Jones Market Data via Morningstar, 6 Nov 2026.
- Markets This Week: Brent Falls 13%, Kospi 12%, Gold Gains 4.5% — Global Terminal, 6 Nov 2026.
Every figure in this piece traces to a source above or to the desk’s own arithmetic on those sources, marked as such. Quotations are short and attributed. Spot an error? Write to the desk; corrections are logged on the method page.
Commentary for information only. Not investment, legal, tax, medical or political advice. Not an offer or solicitation. Analysis may be incomplete or wrong. Charts show published public data, not a trading feed; binding numbers live with the institutions that publish them.