Morning edition · Friday, 6 November 2026
€275.64 for Friday, and a floor that beats most of September
Germany's day-ahead average is the dearest since 29 October. The cheapest hour of the day would still have been an expensive whole day in September.
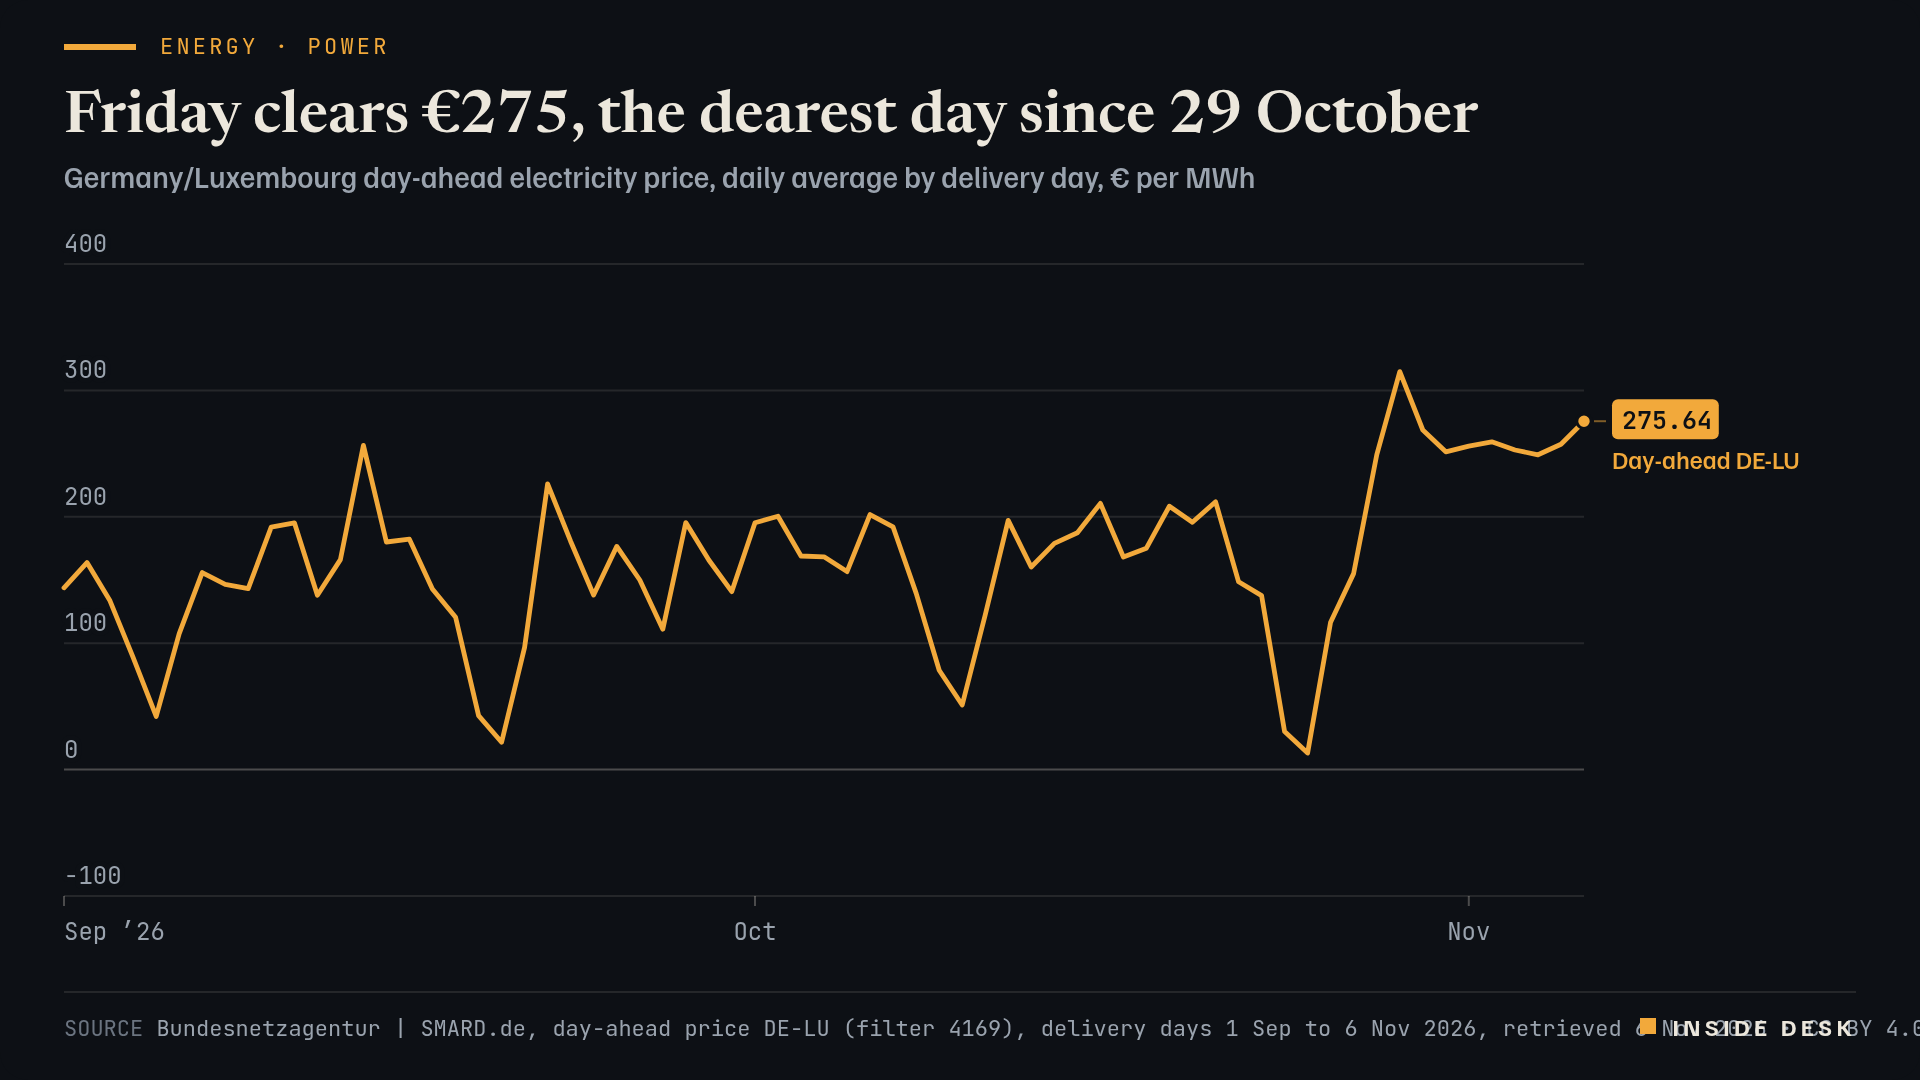
Electricity for delivery in Germany and Luxembourg on Friday 6 November averages €275.64 per megawatt hour on the day-ahead market, according to SMARD1. That is €18.26 above Thursday’s €257.38 and the highest daily average since the €314.85 of Thursday 29 October1.
Line chart of the daily average German-Luxembourg day-ahead electricity price from 1 September to 6 November 2026, in euros per megawatt hour. It falls to €30.12 on Saturday 24 October and €13.12 on Sunday 25 October, then climbs to €314.85 on Thursday 29 October. From late October most delivery days stay near or above €250; Thursday 5 November is €257.38 and Friday 6 November is €275.64, the highest daily average since 29 October.
Source Bundesnetzagentur | SMARD.de, day-ahead price DE-LU (filter 4169), delivery days 1 Sep to 6 Nov 2026, retrieved 6 Nov 2026 · CC BY 4.0. Bundesnetzagentur | SMARD.de, market data. CC BY 4.0.
Data (CSV) · SVG · PNG

Latest values as a table
| Date | Day-ahead DE-LU |
|---|---|
| 2026-11-01 | 255.91 |
| 2026-11-02 | 259.31 |
| 2026-11-03 | 252.85 |
| 2026-11-04 | 248.99 |
| 2026-11-05 | 257.38 |
| 2026-11-06 | 275.64 |
The shape. Prices climb from €229.65 at 05:00 to €323.06 at 07:00, ease to €226.97 at noon, then rise into the evening and peak at €357.12 from 18:001. The spread between the dearest and cheapest hour is €134.741.
The floor. Friday’s cheapest hour, €222.38 at 03:00, would have been a dear whole day in September: only two September delivery days averaged more1. Desk arithmetic: Friday’s average is about 1.9 times September’s €144.821. A high peak says a few hours are tight. A high floor says the system is expensive even when demand is lowest.
Most households do not pay the day-ahead price directly. If you have a dynamic tariff, the least-bad windows remain the small hours and the midday trough; the 17:00–20:00 block is where a dishwasher or an electric car costs the most1. The auction publishes around noon every day. It is one of the freest useful documents in the country. Nothing here is investment advice.
What to watch
A high average is a headline. A high night-time floor is a system.
Sources
- Großhandelspreise: Day-ahead DE-LU (filter 4169), hourly and daily values — Bundesnetzagentur | SMARD.de, retrieved 06 Nov 2026, 05:20 CET.
Every figure in this piece traces to a source above or to the desk’s own arithmetic on those sources, marked as such. Quotations are short and attributed. Spot an error? Write to the desk; corrections are logged on the method page.
Commentary for information only. Not investment, legal, tax, medical or political advice. Not an offer or solicitation. Analysis may be incomplete or wrong. Charts show published public data, not a trading feed; binding numbers live with the institutions that publish them.