Evening edition · Wednesday, 4 November 2026
4.0% on the label, 2.3% underneath: euro-area inflation is an energy bill
Prices across the euro area rose at their fastest pace in three years in October. Strip out energy and the rate has not moved since September.
Euro-area inflation reached 4.0% in October, up from 3.8% in September, according to Eurostat’s flash estimate published this morning1. It is the first time the rate has hit 4% since September 2023, when it stood at 4.3%2. The figure was in line with what economists polled by Reuters had expected2.
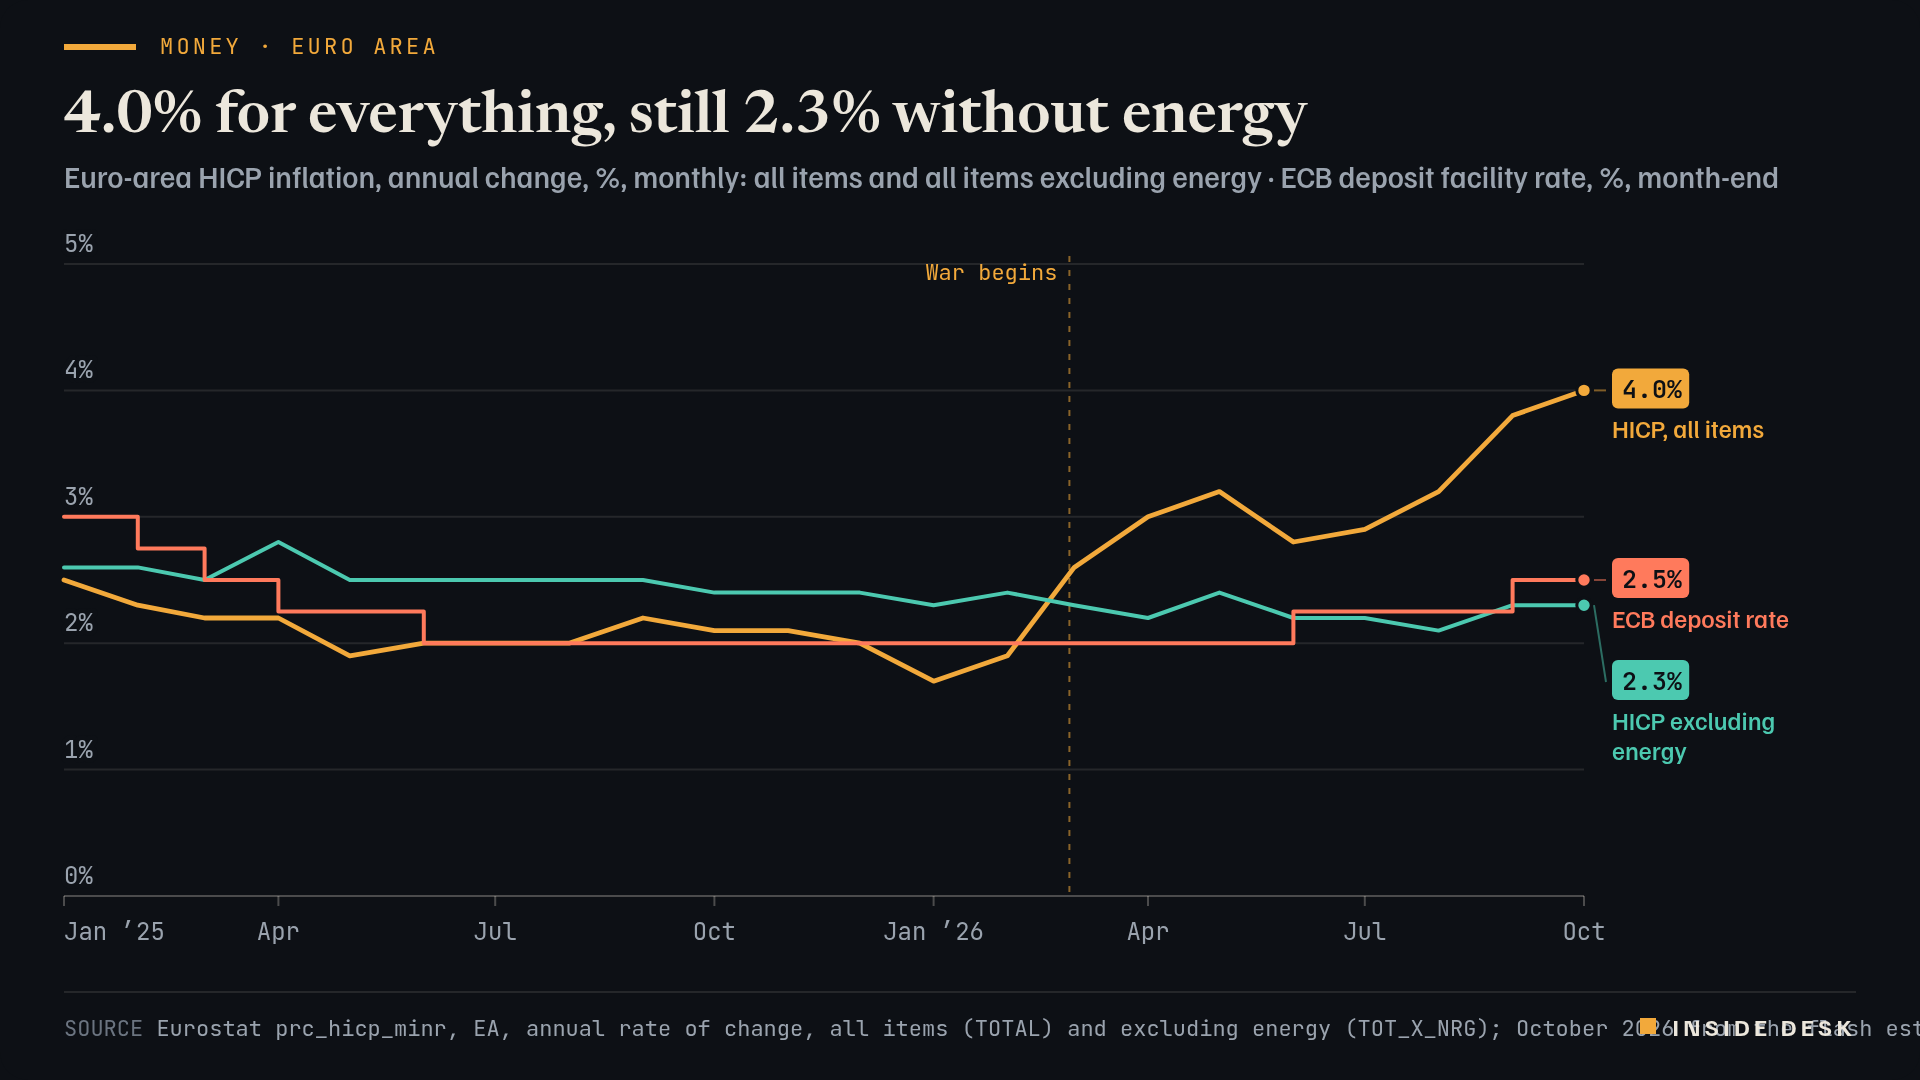
Line chart since January 2025 of euro-area HICP inflation, all items and excluding energy, with the ECB deposit rate. Both inflation lines run between 1.9% and 2.8% through 2025. From March 2026 the all-items line climbs, to 3.2% in May and August, 3.8% in September and 4.0% in October 2026, the latest value, from Eurostat's flash estimate. Inflation excluding energy stays between 2.1% and 2.4% throughout 2026 and is 2.3% in October 2026, the latest value, unchanged from September. The deposit rate falls from 3.00% in January 2025 to 2.00% from June 2025, rises to 2.25% in June 2026 and to 2.50% in September 2026, where the ECB left it on 29 October 2026.
Source Eurostat prc_hicp_minr, EA, annual rate of change, all items (TOTAL) and excluding energy (TOT_X_NRG); October 2026 from the flash estimate of 4 Nov 2026 (estimated) (CC BY 4.0) · ECB, key ECB interest rates, deposit facility, month-end, unchanged on 29 Oct 2026 · retrieved 4 Nov 2026. Eurostat. Reuse authorised under CC BY 4.0 (Commission Decision 2011/833/EU). European Central Bank Data Portal. Reuse permitted with source acknowledgement.
Data (CSV) · SVG · PNG

Latest values as a table
| Date | HICP, all items | HICP excluding energy | ECB deposit rate |
|---|---|---|---|
| 2026-05-01 | 3.2 | 2.4 | 2 |
| 2026-06-01 | 2.8 | 2.2 | 2.25 |
| 2026-07-01 | 2.9 | 2.2 | 2.25 |
| 2026-08-01 | 3.2 | 2.1 | 2.25 |
| 2026-09-01 | 3.8 | 2.3 | 2.5 |
| 2026-10-01 | 4 | 2.3 | 2.5 |
One line did nearly all the climbing. Energy prices were 20.8% higher than a year earlier, up from 18.9% in September; a year ago, in October 2025, they were 0.9% lower1. Everything else barely moved. Inflation excluding energy stayed at 2.3%, and excluding energy, food, alcohol and tobacco it stayed at 2.5%1. Services rose to 3.3% from 3.2%, food, alcohol and tobacco to 1.6% from 1.3%, and non-energy industrial goods to 1.2% from 1.1%1. Energy carries a weight of 90.3 per thousand in the 2026 basket1. Desk arithmetic: that is about 9%, yet the headline has gone from 2.1% a year ago to 4.0% while the other 91% of the basket eased from 2.4% to 2.3%1.
Germany went the other way. German inflation on the harmonised measure fell to 2.8% from 3.3%, with prices 0.1% lower than in September1. Italy jumped to 5.6% from 4.2% and Belgium to 5.2% from 4.5%1. Lithuania, at 6.1%, was the highest; Malta, at 2.3%, the lowest, and every member was above the ECB’s 2% target1,2. The same oil price reaches 21 countries through 21 sets of tariffs, taxes and contracts.
The ECB is weighing what it can see. The bank left its deposit rate at 2.5% last month after a quarter-point rise in September2. Shortly before the release, markets priced a 71.8% chance of another rise in December; afterwards it was more than 72%2. Policymakers have said underlying inflation and wages are broadly stable2.
For your household, the split matters more than the headline. If your bills are mostly rent, food and services, your inflation is closer to the quiet 2-something line than to 4%. If you heat with gas or drive long distances, it is not. Read your own invoices; the average is nobody’s. Nothing here is investment advice.
What to watch
An average is a sentence. The breakdown is the paragraph you actually live in.
Sources
- Euro area annual inflation up to 4.0% (flash estimate, October 2026) — Eurostat, 04 Nov 2026, 11:00 CET.
- Euro zone inflation hits 4% for first time in three years as interest rate hike looms — CNBC, 04 Nov 2026, 11:47 CET.
Every figure in this piece traces to a source above or to the desk’s own arithmetic on those sources, marked as such. Quotations are short and attributed. Spot an error? Write to the desk; corrections are logged on the method page.
Commentary for information only. Not investment, legal, tax, medical or political advice. Not an offer or solicitation. Analysis may be incomplete or wrong. Charts show published public data, not a trading feed; binding numbers live with the institutions that publish them.