Evening edition · Wednesday, 21 October 2026
The Annex: the point of return, read line by line
UNEP's Emissions Gap Report 2026, out today in Nairobi, says 1.5°C will be passed and sets out what it would take to come back below it. Read as a document, it is a ledger of required cuts against pledged ones, with a column of things that already worked.
Today’s annex is the UN Environment Programme’s Emissions Gap Report 2026, “The Point of Return”, published in Nairobi on Wednesday and read here through UNEP’s own release1.
What it assumes. That global warming will pass 1.5°C above pre-industrial levels1. The question it asks is narrower: what is the “lowest possible” overshoot? Its answer is a path on which warming peaks at 1.7–1.8°C around mid-century and returns to or below 1.5°C by 2100, with about a 50% chance1.
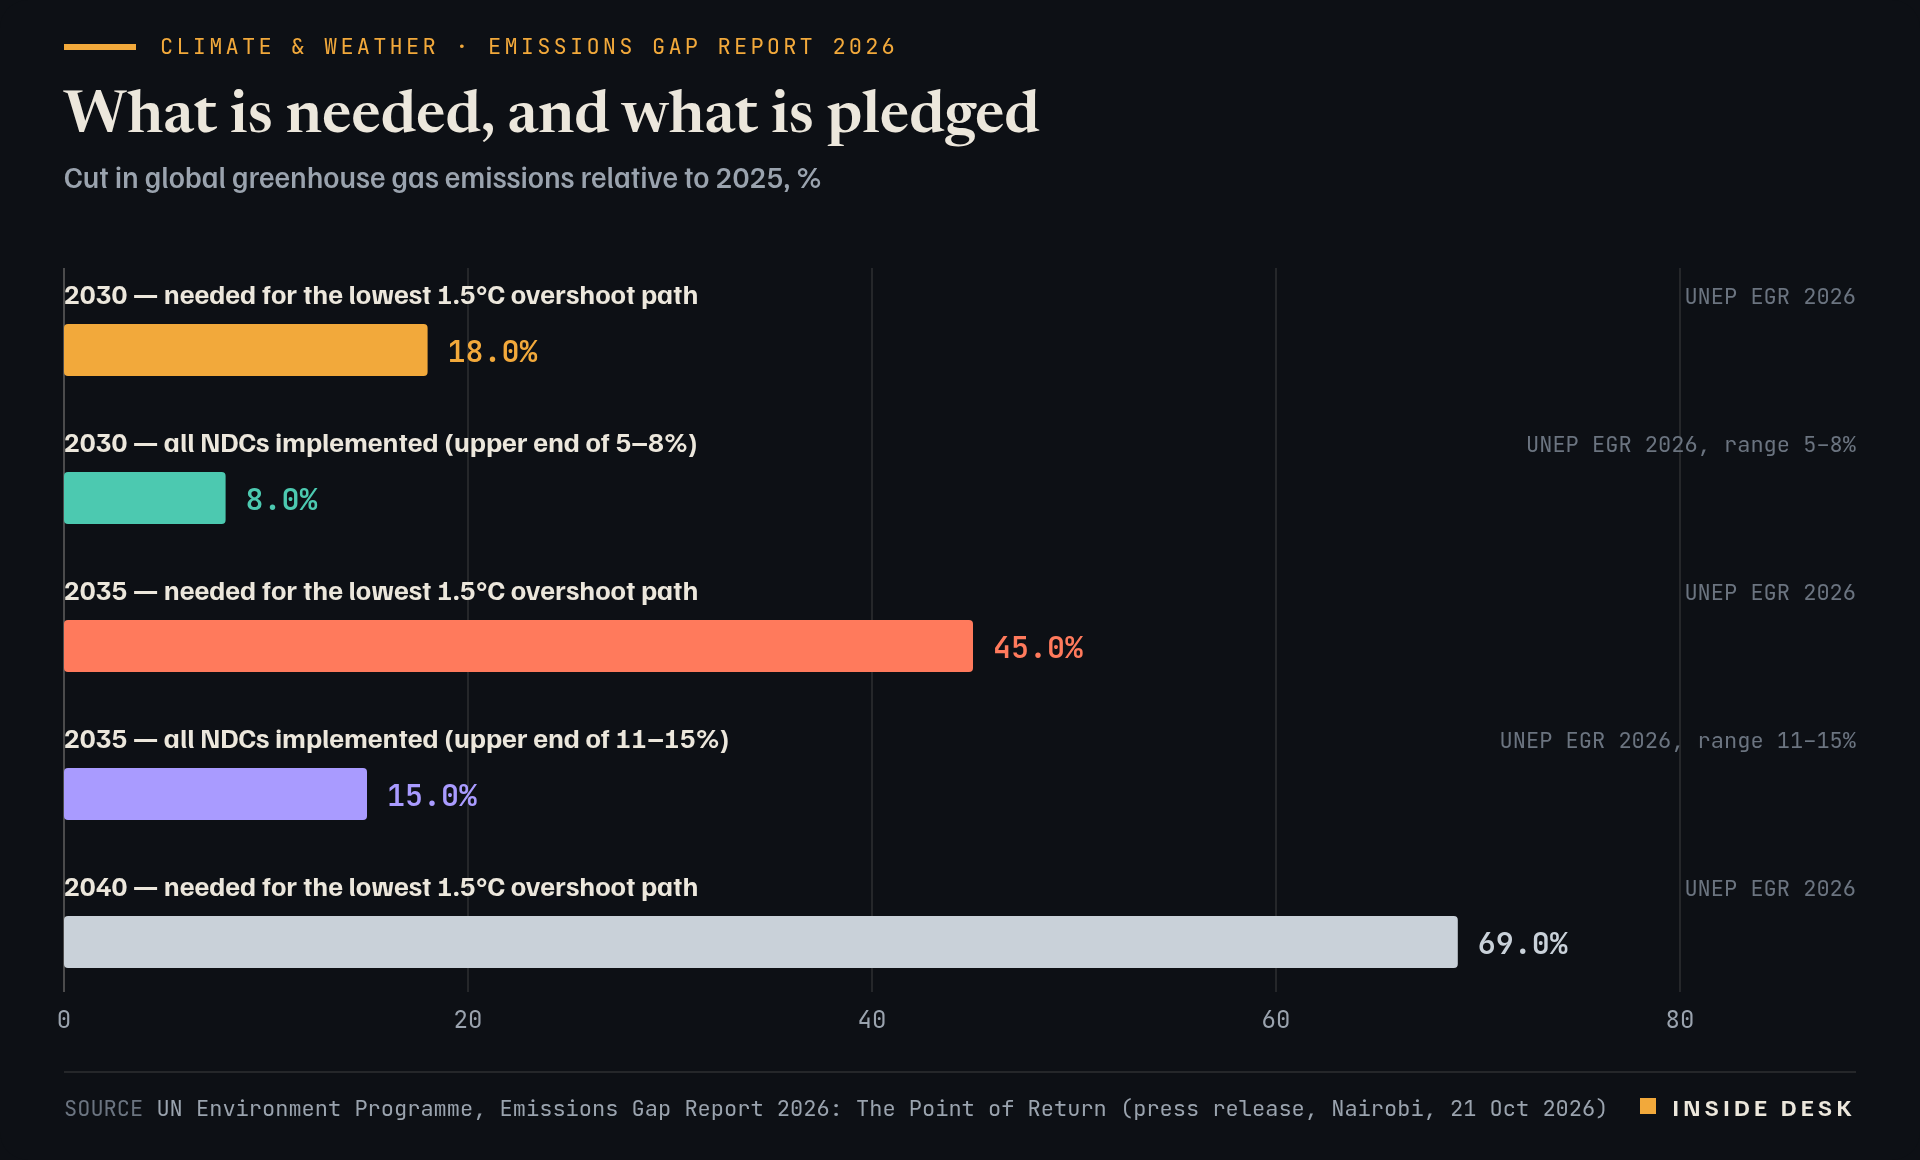
What that path costs in emissions. Global greenhouse gas emissions would have to fall 18% by 2030, 45% by 2035 and 69% by 2040, all against 20251. Full implementation of national pledges, the NDCs, would give 5–8% by 2030 and 11–15% by 20351. The required rate is 5.7% a year for 2025–2035, faster than the roughly 5% in the IPCC’s earlier pathways1.
Bar chart of cuts in global greenhouse gas emissions relative to 2025 in UNEP's Emissions Gap Report 2026. The lowest 1.5°C overshoot path needs 18% by 2030, 45% by 2035 and 69% by 2040. Full implementation of national pledges (NDCs) gives 5–8% by 2030 and 11–15% by 2035; the bars show the upper ends, 8% and 15%.
Source UN Environment Programme, Emissions Gap Report 2026: The Point of Return (press release, Nairobi, 21 Oct 2026). Figures as reported by the named organisations; facts cited with attribution.
Data (CSV) · SVG · PNG

Latest values as a table
| Value | |
|---|---|
| 2030 — needed for the lowest 1.5°C overshoot path | 18% |
| 2030 — all NDCs implemented (upper end of 5–8%) | 8% |
| 2035 — needed for the lowest 1.5°C overshoot path | 45% |
| 2035 — all NDCs implemented (upper end of 11–15%) | 15% |
| 2040 — needed for the lowest 1.5°C overshoot path | 69% |
What happens without it. Current policies point to 2.8°C this century; delivered pledges to 2.6°C1. UNEP says both are worse than last year’s projections because of the United States’ withdrawal from the Paris Agreement and revised estimates of historical emissions1. Every five years of CO2 at current levels adds about 0.1°C to peak warming1.
The column that already worked. More than 220 policy evaluations are cited. Electricity-sector policies cut emissions by an average of 9%; carbon taxes and cap-and-trade schemes by 5–13%1. Since the Paris Agreement, global renewable capacity has grown three times faster than anticipated and solar seven times faster1. If that continues, with additional policy, the world would be on track to triple renewable capacity by 20301.
The caveat it states itself. The path also needs the removal and permanent storage of about 320 gigatonnes of CO2 this century, roughly eight years of 2024’s emissions, and UNEP calls the chances of achieving that “uncertain”1.
The reading. Strip out the adjectives and the document is a set of rates, a gap between two columns, and a list of policies with measured effects. “Overshoot is not surrender,” said UN Secretary-General António Guterres1. The more useful sentence is the dull one: the tools that cut 9% in electricity are known, and the report counts them.
What to watch
- Whether countries extend the first Global Stocktake goals to 2035 and 2040 in the second stocktake, as the report proposes1.
- How much carbon removal is planned rather than assumed; the scenario needs about 320 gigatonnes of CO2 this century1.
- Next year's report, which will show whether new pledges moved the projections; this year's made a negligible difference1.
A target is a speech. A cut rate is an invoice. This report sends the invoice.
Sources
- New UNEP report lays out emission cuts needed for return to 1.5°C — UN Environment Programme, 21 Oct 2026, Nairobi.
Every figure in this piece traces to a source above or to the desk’s own arithmetic on those sources, marked as such. Quotations are short and attributed. Spot an error? Write to the desk; corrections are logged on the method page.
Commentary for information only. Not investment, legal, tax, medical or political advice. Not an offer or solicitation. Analysis may be incomplete or wrong. Charts show published public data, not a trading feed; binding numbers live with the institutions that publish them.