Morning edition · Friday, 13 November 2026
480 GWh promised, 480 GWh delivered: the week the wind kept its word and the price more than halved
Thursday's wind came in within a tenth of a per cent of the forecast. Five auctions, read in a row, show what that is worth.
On Thursday morning we told you the regulator’s forecast expected about 479 GWh of wind for the day. The meters have now had the whole day. Onshore and offshore turbines together delivered about 480.0 GWh on Thursday, against 479.4 GWh forecast1. Desk arithmetic: that is about 0.1% more than promised, and about 3.3 times Wednesday’s 145.6 GWh1.
The total hid a swap. Onshore wind came in at about 324.8 GWh, roughly 7% under its forecast; offshore delivered about 155.2 GWh, roughly 19% over1. Desk arithmetic, both. Land disappointed, sea compensated, and the sum landed where the forecasters said it would. Nobody gave a speech about it.
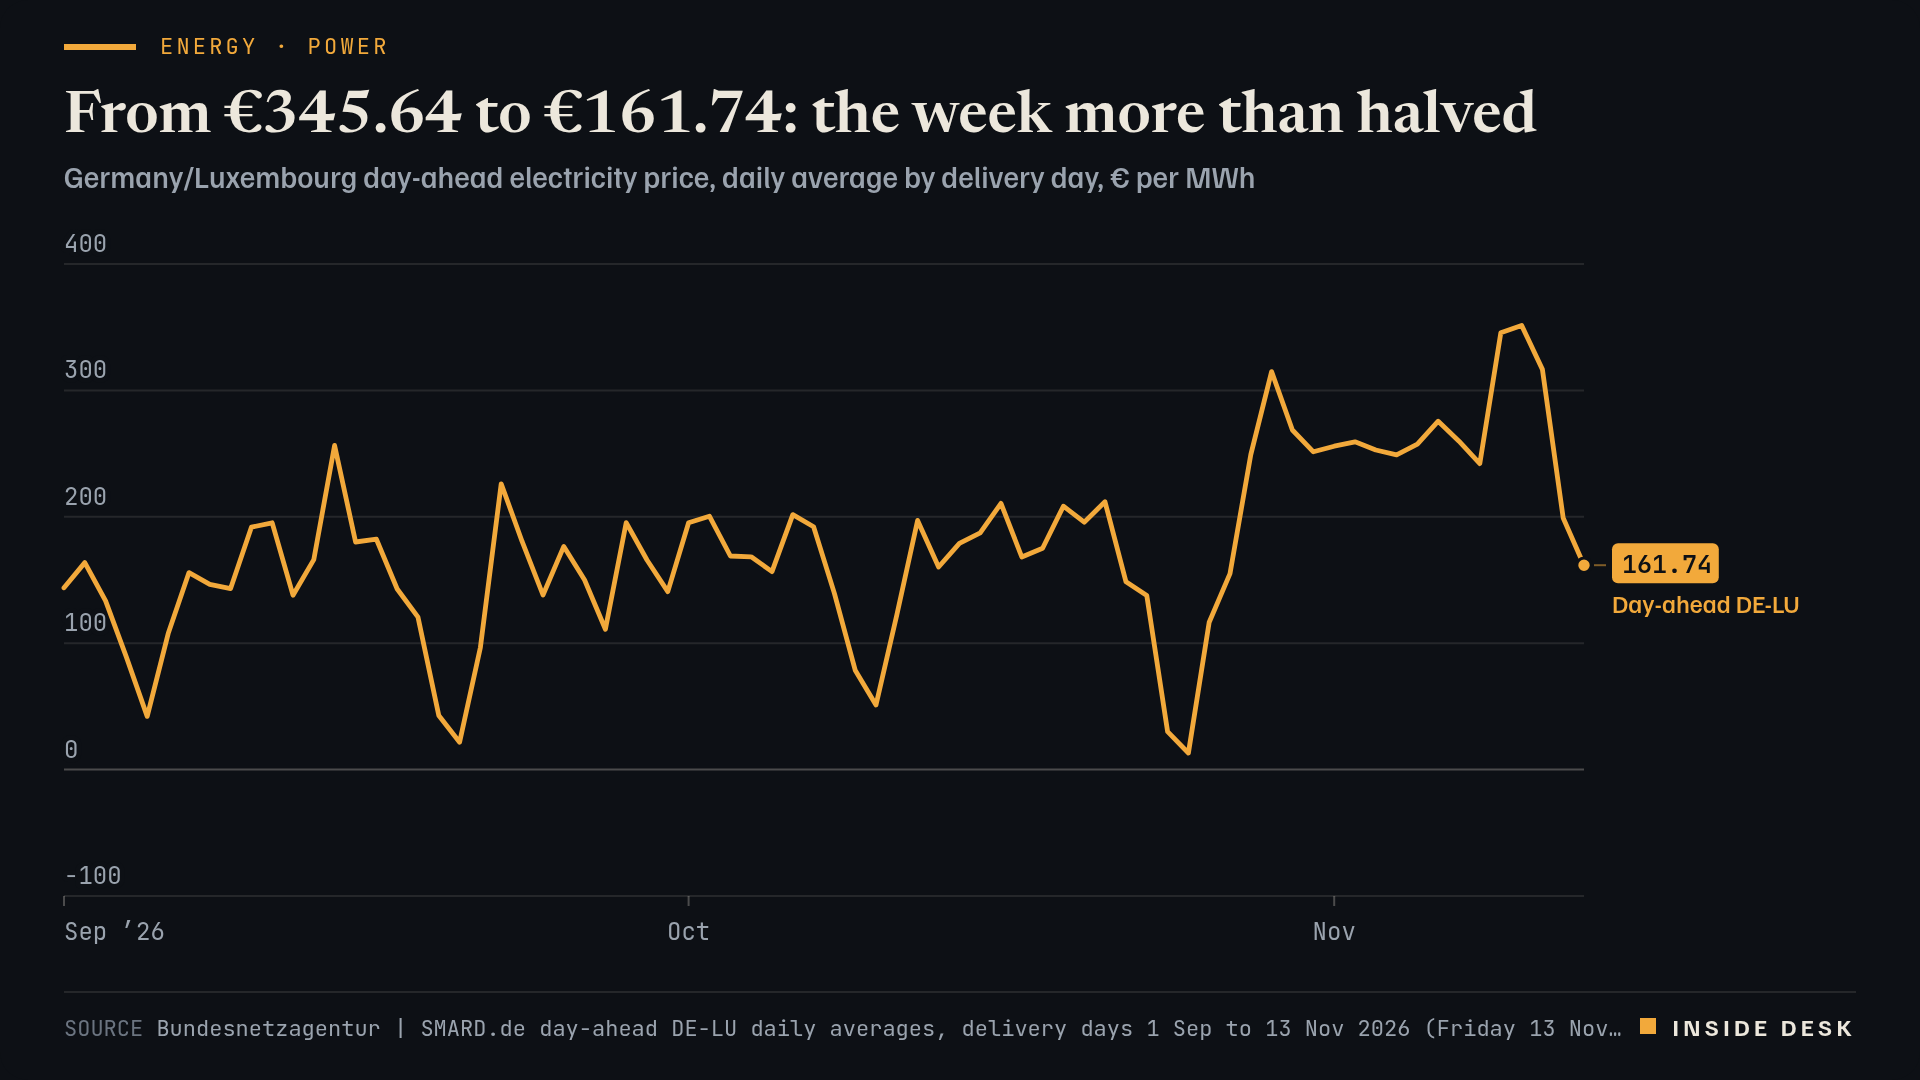
Five auctions in a row. Read the week as a ledger and the effect is plain. Delivery on Monday 9 November averaged €345.64 per megawatt hour for Germany and Luxembourg; Tuesday a record €351.48; Wednesday €316.65; Thursday €199.05; Friday €161.742. Desk arithmetic: the five-day average is €274.91, against €258.83 for Monday to Friday of the week before, and Friday is about 54% below Tuesday’s record2.
Line chart of the daily average German-Luxembourg day-ahead electricity price from 1 September to 13 November 2026, in euros per megawatt hour. It falls to €13.12 on Sunday 25 October, climbs to €314.85 on Thursday 29 October, and stays between €242.13 and €275.64 on every delivery day from 2 to 8 November. In the week of 9 November it reads €345.64 on Monday, a record €351.48 on Tuesday, €316.65 on Wednesday and €199.05 on Thursday. The latest value is €161.74 for delivery on Friday 13 November, €37.31 below Thursday, €189.74 below Tuesday's record and the lowest delivery day since €155.12 on Tuesday 27 October.
Source Bundesnetzagentur | SMARD.de day-ahead DE-LU daily averages, delivery days 1 Sep to 13 Nov 2026 (Friday 13 Nov €161.74, auction of 12 Nov), retrieved 13 Nov 2026, 05:17 CET · CC BY 4.0. Bundesnetzagentur | SMARD.de, market data. CC BY 4.0.
Data (CSV) · SVG · PNG

Latest values as a table
| Date | Day-ahead DE-LU |
|---|---|
| 2026-11-08 | 242.13 |
| 2026-11-09 | 345.64 |
| 2026-11-10 | 351.48 |
| 2026-11-11 | 316.65 |
| 2026-11-12 | 199.05 |
| 2026-11-13 | 161.74 |
Friday started windy. In the first four hours of Friday, provisional SMARD data show about 142.0 GWh of wind, 114.6 GWh of it onshore1. Desk arithmetic: four hours of Friday night produced almost as much wind power as the whole of Wednesday. The offshore forecast for the full day is about 137.4 GWh; the onshore and solar forecasts for Friday had not been published when we checked at 05:17 CET1. So we cannot tell you how the rest of the day will run, and we will not guess.
For you. A cheap week is not made by policy or by press release. It is made by a forecast, an auction and a meter, published in that order and in public. On a dynamic tariff, the prices for Friday were fixed on Thursday and are already visible hour by hour2. On a fixed tariff, your supplier bought long ago and nothing changes this week. Nothing here is investment advice.
What to watch
A forecast you can check is worth more than a promise you cannot.
Sources
- Marktdaten: Realisierte Erzeugung (wind onshore, wind offshore) and Prognostizierte Erzeugung, quarter-hourly, 11 to 13 Nov 2026 — Bundesnetzagentur | SMARD.de, retrieved 13 Nov 2026, 05:17 CET.
- Marktdaten: Großhandelspreise DE/LU day-ahead, hourly (filter 4169), delivery 2 to 13 Nov 2026 — Bundesnetzagentur | SMARD.de, retrieved 13 Nov 2026, 05:17 CET.
Every figure in this piece traces to a source above or to the desk’s own arithmetic on those sources, marked as such. Quotations are short and attributed. Spot an error? Write to the desk; corrections are logged on the method page.
Commentary for information only. Not investment, legal, tax, medical or political advice. Not an offer or solicitation. Analysis may be incomplete or wrong. Charts show published public data, not a trading feed; binding numbers live with the institutions that publish them.