Evening edition · Tuesday, 10 November 2026
0.4%, 0.3%, and a 2-year yield up 15 basis points
The price index arrived without its annual figure and still said enough. The market did not need a twelve-month number to read a third 0.3% in a row.
The morning edition warned you that October’s consumer price index would arrive with a hole where its headline usually sits. It did. At 14:30 CET the Bureau of Labor Statistics published the table, and in the column for twelve-month changes most cells simply read “-”1. No October 2025 survey was collected during last year’s lapse in appropriations, so for most series there is nothing to compare against1. Gasoline is one of the exceptions: up 37.4% on the year, unadjusted1.
What the bureau could publish was the month, and the month was firm. All items rose 0.4% on a seasonally adjusted basis after 0.6% in September1. Prices excluding food and energy rose 0.3%, “as it did in September and August”1. Economists surveyed by Dow Jones had looked for 0.3% and 0.2% respectively2; Reuters’ poll had the same 0.3% for the headline and 0.2% for core3. One tenth of a point on each, which sounds small until you remember what a tenth compounds into.
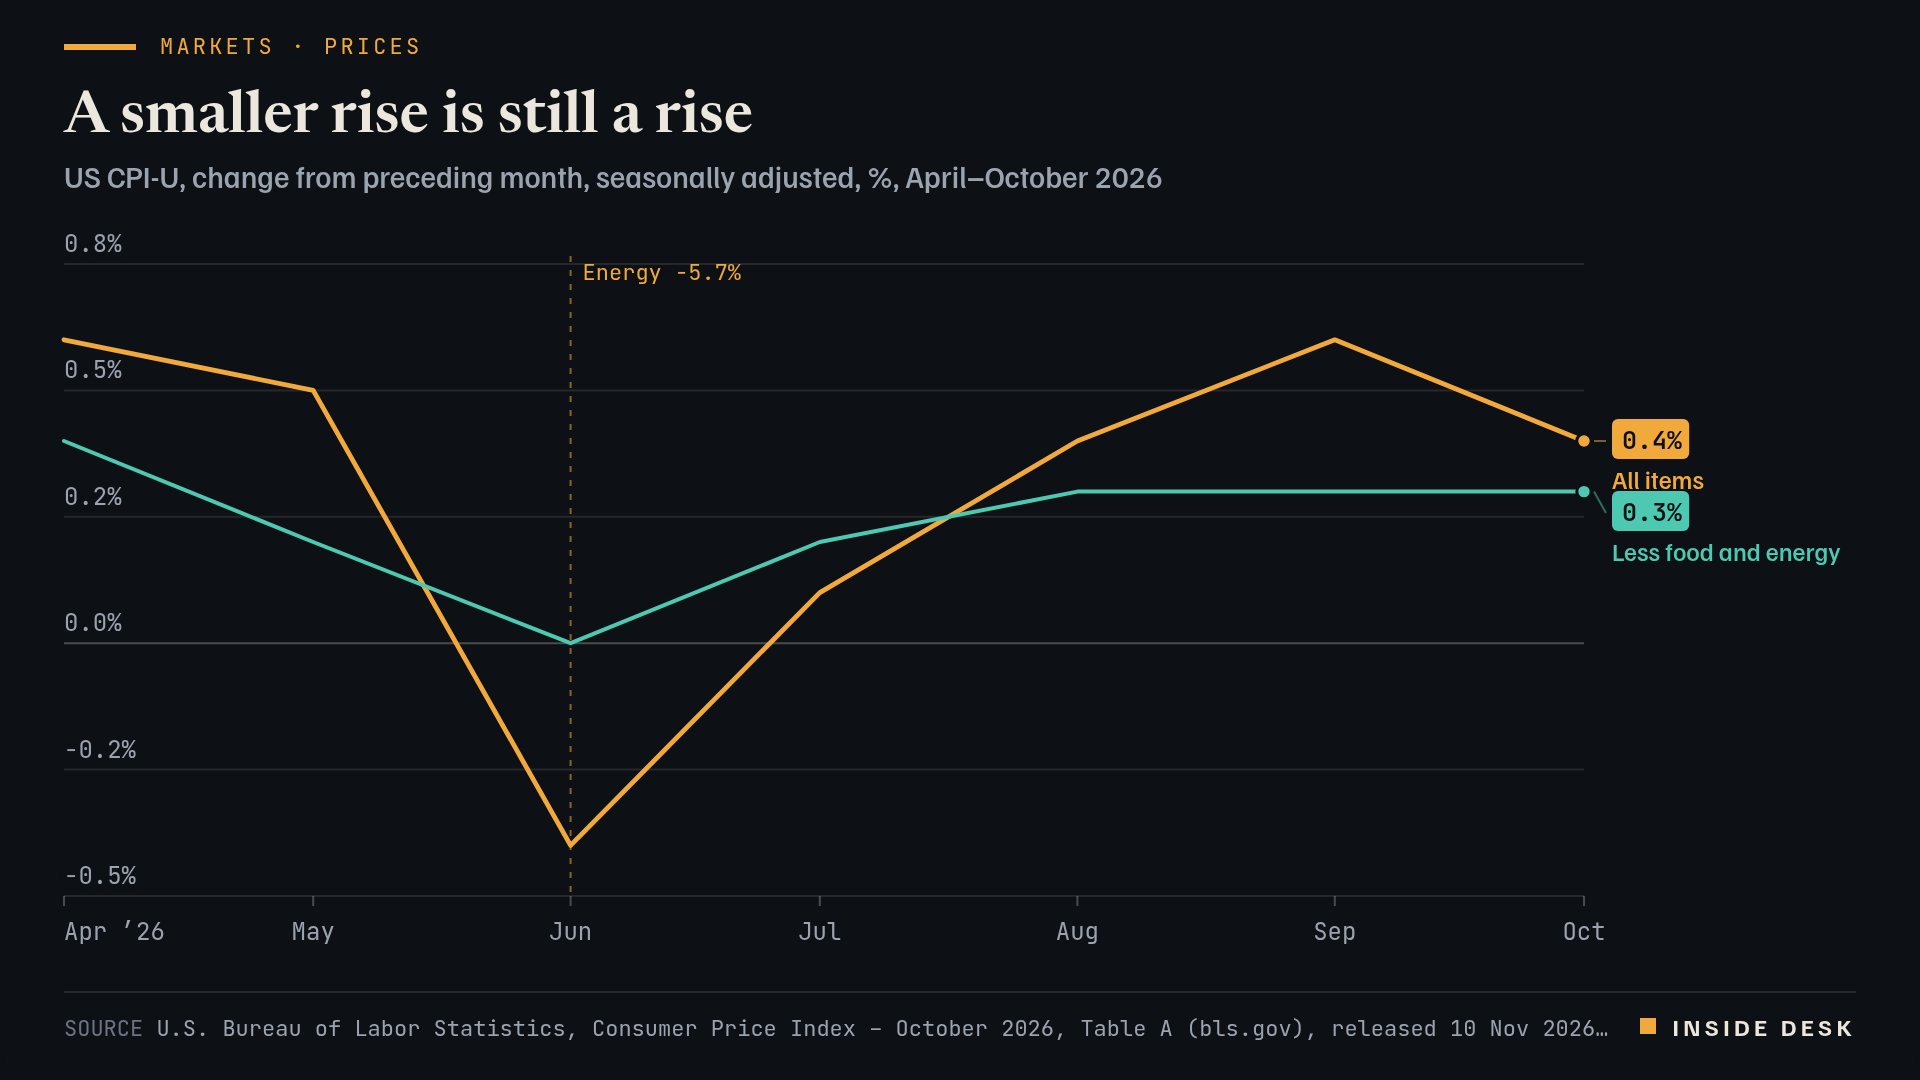
Line chart of the monthly change in the US consumer price index, seasonally adjusted, from April to October 2026. All items rose 0.6% in April, 0.5% in May, fell 0.4% in June, then rose 0.1% in July, 0.4% in August and 0.6% in September. Core prices, excluding food and energy, rose 0.4%, 0.2%, 0.0%, 0.2%, 0.3% and 0.3% over the same months. In October 2026, the latest value, all items rose 0.4% and core rose 0.3%, a third straight 0.3% core reading.
Source U.S. Bureau of Labor Statistics, Consumer Price Index – October 2026, Table A (bls.gov), released 10 Nov 2026, retrieved 10 Nov 2026 · U.S. government data, public domain. Figures as reported by the named organisations; facts cited with attribution.
Data (CSV) · SVG · PNG

Latest values as a table
| Date | All items | Less food and energy |
|---|---|---|
| 2026-05-01 | 0.5 | 0.2 |
| 2026-06-01 | -0.4 | 0 |
| 2026-07-01 | 0.1 | 0.2 |
| 2026-08-01 | 0.4 | 0.3 |
| 2026-09-01 | 0.6 | 0.3 |
| 2026-10-01 | 0.4 | 0.3 |
Where the tenth came from. Shelter rose 0.3% and accounted for over thirty per cent of the monthly increase1. Food rose 0.5%, with beef up 0.9% and snacks up 1.0%1. Energy rose 0.7%, far slower than September’s 5.2%, with electricity up 0.9% and piped gas down 0.8%1. Transportation services rose 0.8%; motor vehicle insurance rose 0.7%; hospital services rose 0.8%1. Used cars and trucks fell 1.2%1. That is the useful part of the release: not one shock, but many small invoices moving the same way. Before seasonal adjustment, gasoline actually fell 0.7% in October; the adjusted index still shows a 1.0% rise1. Both are true, and the bureau prints both.
How the market read it. Within the hour, the US two-year yield, the maturity most sensitive to the Fed, rose 15 basis points to 4.69%, and the ten-year rose 9 basis points to 4.96%, according to Reuters3. The Nasdaq fell 1% and the S&P 500 0.6%; the dollar index rose 0.3% to 102.01; gold fell 2% to $4,057 an ounce3. CME FedWatch went to a fully priced quarter-point hike at the 8–9 December meeting, with odds of a half-point move at 13.6%, from around zero before the release, CNBC reported2. LSEG data showed traders fully pricing two 25-basis-point rises by March4.
The speech had come first. In London on Tuesday morning, Fed Governor Christopher Waller said he would back a 25-basis-point rise in December even if October improved, and added that if core inflation came in “around 0.3 percent or even higher”, a 50-basis-point hike “should be considered”, since hiking only 25 would “put our credibility at risk”5. It came in at 0.3%1. Desk arithmetic: by the governor’s own test, the condition for discussing the bigger step has been met; whether the committee takes it is a decision for 9 December, not for a Tuesday afternoon.
Europe kept most of its morning. The day had started with relief: Brent fell more than 3% and dipped below $90 a barrel for the first time since late August, and the STOXX 600 traded within 1% of its record4. After the print, Reuters had the STOXX 600 up 0.6%, off its session highs4. The DAX, which closed Monday at 26,267.19, touched 26,633.78 during the day; the latest quote this desk fetched before writing was 26,473.63, up 0.81%6. A settled close was not yet available at the time of writing.
What this means for you. Resist the two loud readings. One says the missing annual figure makes the report meaningless; it does not, because a third 0.3% core month is a pattern, not a rounding error1. The other says a hot print is a crisis; it is not, because the machinery worked exactly as designed: data at 14:30, yields repriced within the hour, a committee meeting in four weeks with the evidence on the table. If you carry a dollar loan or a variable rate tied to US policy, the number that moved today is the two-year, not the index. If your savings are in euros, the more useful line is that oil fell further on the same day4.
The next instalments are already scheduled: producer prices on Friday 13 November at 14:30 CET7, and November’s CPI on 10 December, the day after the Fed decides1. Between them sits a holiday, a meeting and a great many invoices. Nothing here is investment advice.
What to watch
- The Fed's 8–9 December meeting: the argument is now 25 or 50 basis points, not whether2,3.
- US producer prices for October, due Friday 13 November at 14:30 CET; Wednesday is the Veterans Day holiday7.
- The next CPI, for November, is scheduled for Thursday 10 December at 14:30 CET, the day after the Fed decides1.
A missing year is not a missing fact. The month was there, and the month was enough.
Sources
- Consumer Price Index Summary – October 2026 — U.S. Bureau of Labor Statistics, 10 Nov 2026, 14:30 CET.
- Consumer prices rose 0.4% in October, more than expected, complicating Fed's inflation fight — CNBC, 10 Nov 2026, 14:31 CET.
- Hot October inflation report rattles markets (Reuters) — MarketScreener / Reuters, 10 Nov 2026, 15:03 CET, updated 15:31 CET.
- Stocks cut gains, dollar and yields up as US CPI cements December rate hike bets (Reuters) — Euronext Live / Reuters, 10 Nov 2026, 14:58 CET.
- The Economic Outlook and Some Thoughts on Labor Market Dynamism — Federal Reserve Board (Governor Christopher J. Waller), 10 Nov 2026.
- Xetra DAX (DEX.) — Sharecast, 10 Nov 2026, intraday.
- Schedule of Selected Releases for November 2026 — U.S. Bureau of Labor Statistics, updated 3 Nov 2026.
Every figure in this piece traces to a source above or to the desk’s own arithmetic on those sources, marked as such. Quotations are short and attributed. Spot an error? Write to the desk; corrections are logged on the method page.
Commentary for information only. Not investment, legal, tax, medical or political advice. Not an offer or solicitation. Analysis may be incomplete or wrong. Charts show published public data, not a trading feed; binding numbers live with the institutions that publish them.