Morning edition · Tuesday, 3 November 2026
Corn 74%, soybeans 88%: the harvest report that came back
Last autumn a funding lapse cancelled six weeks of America's crop counts. This year the Monday sheet arrived on time, and it reads like a dry autumn: the beans are early, the corn and sorghum a little late, the soil short of water.
Every Monday from April to the end of November, the US Department of Agriculture publishes a few pages on how far the country’s farms have got. Last autumn, the pages stopped: because of a lapse in federal funding, the reports for the weeks ending 5 October to 9 November 2025 were cancelled, and this year’s sheet still says so in a special note at the top1. So the “previous year” column reads “NA”, and the five-year averages fill the 2025 gap with imputed estimates1. A missing number is a cost too, and farmers, grain buyers and insurers paid it last year.
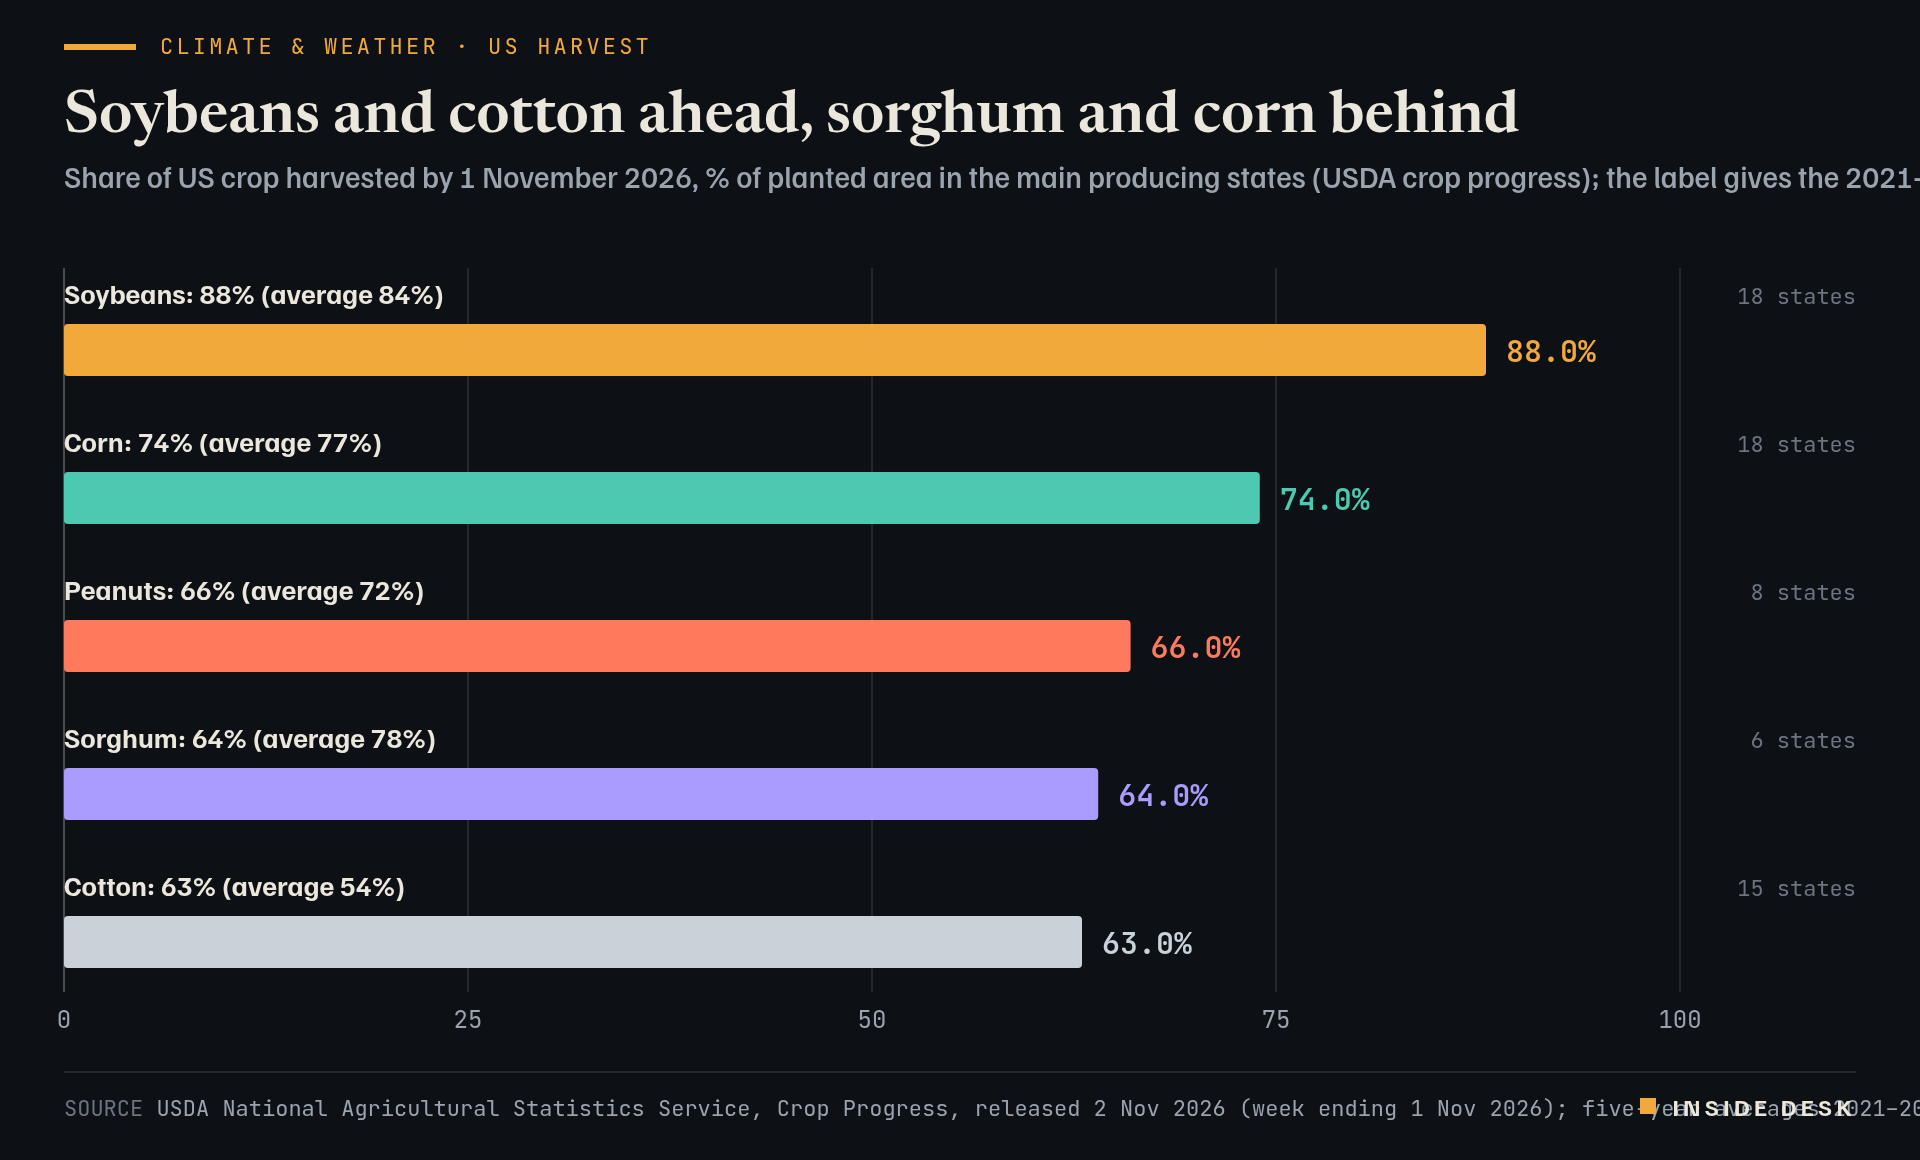
This year’s report for the week to 1 November arrived on schedule on Monday evening1. Corn was 74% harvested across the 18 main states, up from 60% a week earlier and behind the 2021–2025 average of 77%1. Soybeans were 88% in, ahead of the 84% average1. Cotton is ahead, sorghum and peanuts behind1.
Bar chart of the share of each US crop harvested by 1 November 2026, the latest week, from USDA's Crop Progress report. Soybeans 88% against a 2021–2025 average of 84%. Corn 74% against 77%. Peanuts 66% against 72%. Sorghum 64% against 78%. Cotton 63% against 54%.
Source USDA National Agricultural Statistics Service, Crop Progress, released 2 Nov 2026 (week ending 1 Nov 2026); five-year averages 2021–2025, with 2025 imputed because last autumn's reports were cancelled during the funding lapse; retrieved 3 Nov 2026 · US government work, public domain. Figures as reported by the named organisations; facts cited with attribution.
Data (CSV) · SVG · PNG

Latest values as a table
| Value | |
|---|---|
| Soybeans: 88% (average 84%) | 88% |
| Corn: 74% (average 77%) | 74% |
| Peanuts: 66% (average 72%) | 66% |
| Sorghum: 64% (average 78%) | 64% |
| Cotton: 63% (average 54%) | 63% |
The state lines show where the gap is. Iowa’s corn is 66% harvested against an average of 79%; Nebraska’s 66% against 75%; South Dakota’s 63% against 75%1. Illinois, at 86%, is ahead of its 83% average1. Sorghum is furthest behind: 64% harvested against an average of 78%, with Kansas at 49% against 70% and Nebraska at 42% against 71%1.
The weather part is in the soil tables. Across the 48 states, 38% of topsoil was rated short or very short of moisture, the same as a week earlier, and only 6% had a surplus1. Next year’s crop is already in the ground: winter wheat is 83% planted, against an 84% average, and 65% has emerged1. In its first condition rating of the season, 44% of that wheat was rated good or excellent and 18% poor or very poor; in Texas the poor and very poor share is 34%, and in Oklahoma 25%1. Desk arithmetic: the shares add USDA’s separate categories, very short plus short for soil, good plus excellent and poor plus very poor for the wheat.
None of this is a verdict on prices or yields, and the report offers none. It is a weekly survey of about 3,600 people whose work brings them into contact with farmers in their counties, weighted by acreage and run from early April to the end of November1. The constructive point is the dull one: the counting happened, it was published on time, and you can read it state by state.
What to watch
A crop count is only dull until the week it doesn't arrive.
Sources
- Crop Progress, week ending 1 November 2026 — USDA National Agricultural Statistics Service, 02 Nov 2026, 22:00 CET.
Every figure in this piece traces to a source above or to the desk’s own arithmetic on those sources, marked as such. Quotations are short and attributed. Spot an error? Write to the desk; corrections are logged on the method page.
Commentary for information only. Not investment, legal, tax, medical or political advice. Not an offer or solicitation. Analysis may be incomplete or wrong. Charts show published public data, not a trading feed; binding numbers live with the institutions that publish them.