Morning edition · Tuesday, 3 November 2026
$618 billion to borrow by Christmas, and a 30-year yield back where September began
Washington's quarterly shopping list arrived on the eve of the vote. The long end of the bond market had already cooled since October.
While the campaigns made their last speeches, the US Treasury published a table. It expects to borrow $618 billion in privately held net marketable debt in October to December, assuming it ends December with $850 billion in cash1. That is $10 billion less than it estimated in August1. For January to March it expects $800 billion1.
The smaller number is not quite a saving. Treasury says the lower estimate comes mainly from starting the quarter with more cash than assumed: $984 billion instead of $950 billion1. Leave that out, and this quarter’s borrowing estimate is $24 billion higher than in August1. Desk arithmetic: $618 billion plus $800 billion is $1.418 trillion of net new borrowing from the public in six months.
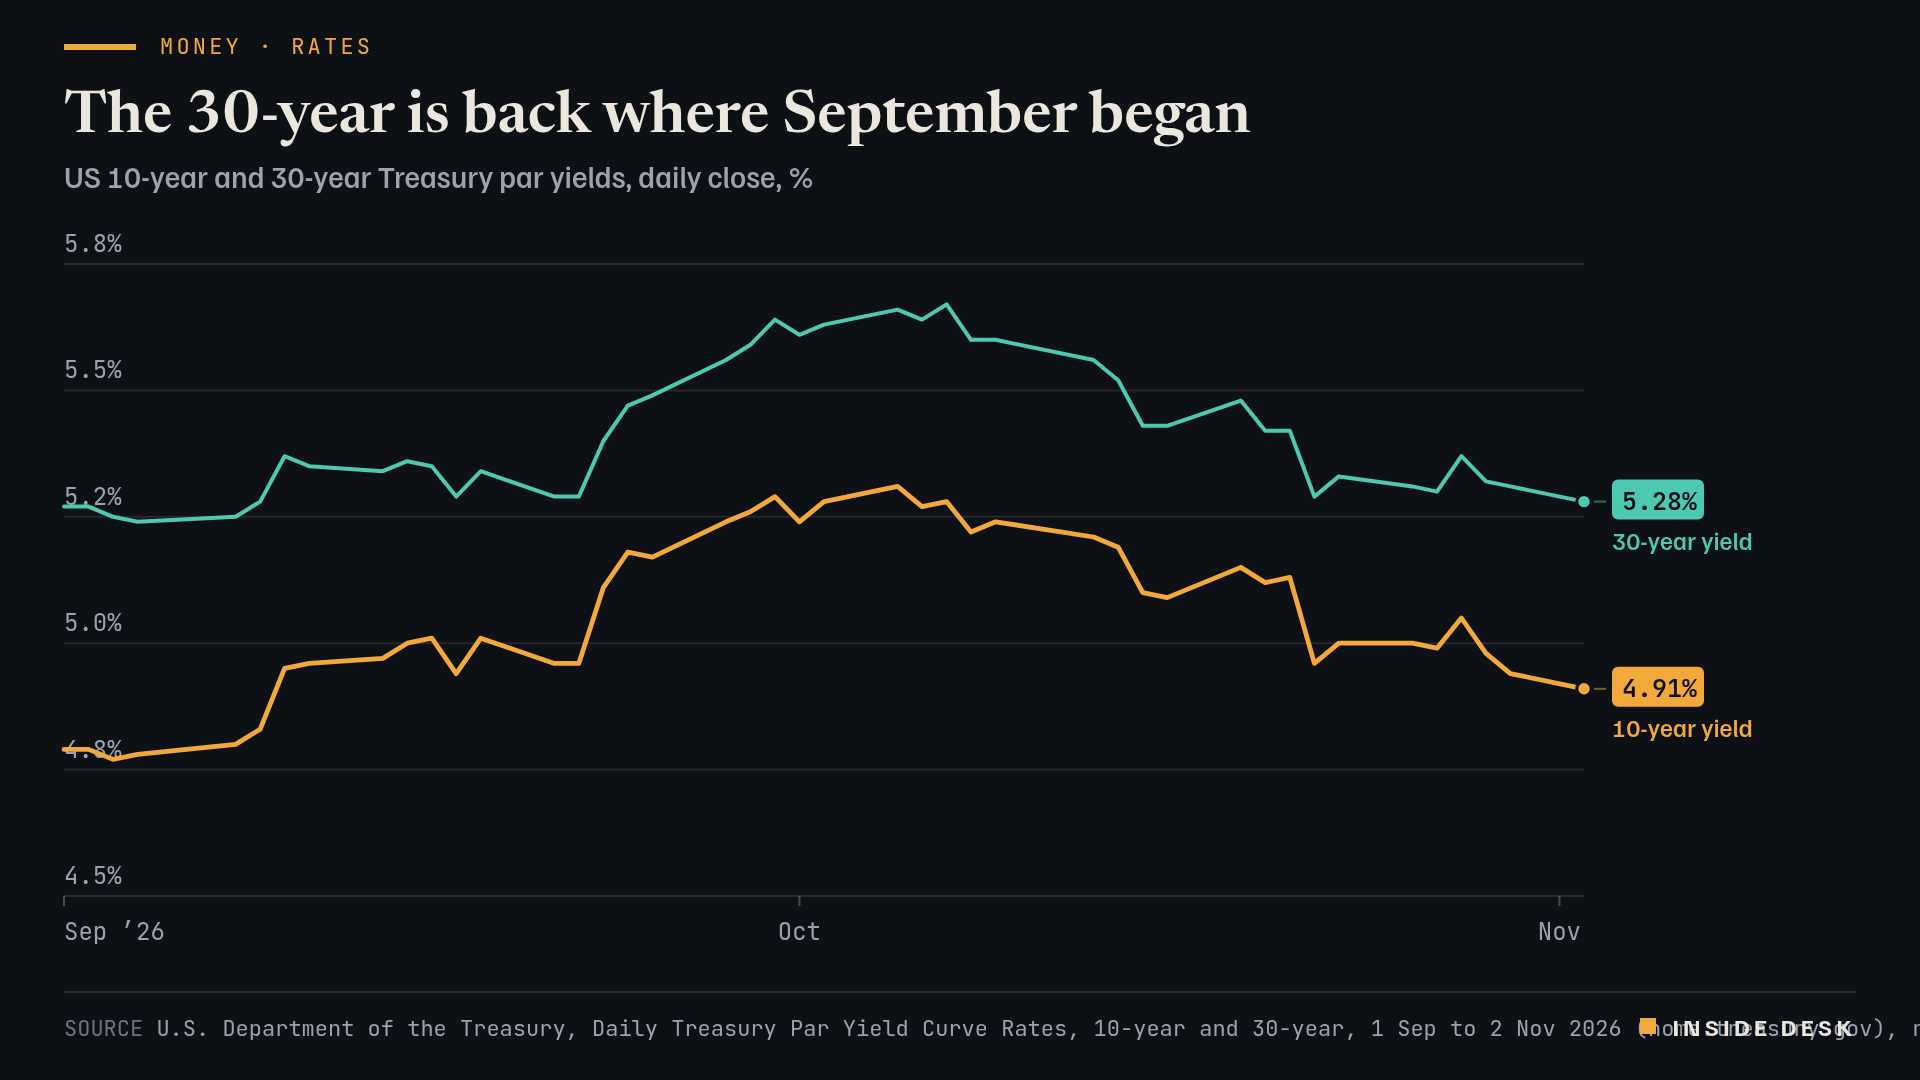
Line chart of the daily US 10-year and 30-year Treasury par yields from 1 September to 2 November 2026. On 1 September the 10-year is at 4.79% and the 30-year at 5.27%. Both climb through September; the 10-year peaks at 5.31% on 5 October and the 30-year at 5.67% on 7 October. Both then fall through October. On Monday 2 November 2026, the latest value, the 10-year is at 4.91% and the 30-year at 5.28%, one hundredth of a point above where it began September.
Source U.S. Department of the Treasury, Daily Treasury Par Yield Curve Rates, 10-year and 30-year, 1 Sep to 2 Nov 2026 (home.treasury.gov), retrieved 3 Nov 2026 · U.S. government data, public domain. Figures as reported by the named organisations; facts cited with attribution.
Data (CSV) · SVG · PNG

Latest values as a table
| Date | 10-year yield | 30-year yield |
|---|---|---|
| 2026-10-26 | 5 | 5.31 |
| 2026-10-27 | 4.99 | 5.3 |
| 2026-10-28 | 5.05 | 5.37 |
| 2026-10-29 | 4.98 | 5.32 |
| 2026-10-30 | 4.94 | 5.31 |
| 2026-11-02 | 4.91 | 5.28 |
The price of that borrowing has eased. The 10-year Treasury yield closed at 4.91% on Monday and the 30-year at 5.28%, according to Treasury’s daily par yield curve2. Both were far higher in early October: 5.31% for the 10-year on 5 October and 5.67% for the 30-year on 7 October2. The 30-year is now one hundredth of a point above its 5.27% of 1 September2. The short end moved the other way on Monday: the 3-month bill yield rose to 4.21% from 4.16%2.
Why this matters to you. The 10-year yield is a reference rate for mortgages, company loans and, eventually, the interest on your savings. A government that borrows $1.4 trillion in two quarters is not unusual in the US; that the auctions are planned, published and held on time is the machinery that keeps the price orderly. The detail that counts comes on Wednesday afternoon our time, when Treasury says what it will sell, and in which maturities1. Nothing here is investment advice.
What to watch
Speeches decide what a government wants. The refunding table decides how it pays, a quarter at a time.
Sources
- Treasury Announces Marketable Borrowing Estimates — U.S. Department of the Treasury, 02 Nov 2026.
- Daily Treasury Par Yield Curve Rates, 2026 — U.S. Department of the Treasury, retrieved 03 Nov 2026, 05:20 CET.
Every figure in this piece traces to a source above or to the desk’s own arithmetic on those sources, marked as such. Quotations are short and attributed. Spot an error? Write to the desk; corrections are logged on the method page.
Commentary for information only. Not investment, legal, tax, medical or political advice. Not an offer or solicitation. Analysis may be incomplete or wrong. Charts show published public data, not a trading feed; binding numbers live with the institutions that publish them.