Morning edition · Friday, 30 October 2026
The shares took the blame; the bonds got the money
A week of cash-burning tech results ended with Asia's chipmakers falling and Treasuries heading for their best month since December 2023. The money did not vanish. It moved.
Friday morning in Asia looked like a rout if you read only the share prices. South Korea’s KOSPI slumped 5%, which takes its October fall past 17%, Reuters reports, and Japan’s Nikkei fell 3%1. China’s blue-chip CSI300 was heading for its largest monthly fall in a decade1. Nasdaq 100 futures were down 1.4%1. Read the other half of the screen, though, and the story changes. Bonds were surging towards their biggest monthly gain in nearly three years1.
That is the useful finding of the week. The money that left the AI trade did not disappear into panic. It went somewhere orderly.
What the shares were punishing. Not weak sales. Alphabet fell 12.6% on Wall Street and slipped further after hours, wiping out about $500 billion in market value, after heavy AI spending turned its cash flow negative1. After the US close, Intel dropped 23% in extended trading and Amazon about 7%, both for the same reason: cash going out faster than it comes in1. Intel’s own quarter was not a disaster. Revenue rose 21% to $16.51 billion, in line with estimates, and adjusted profit of 52 cents a share beat the 40 cents expected3. But it forecast fourth-quarter revenue of $15–16 billion, below the $17.07 billion analysts expected, and said it does not expect positive cash flow this year3. “It’s increasingly questioning whether shareholders will earn an adequate return on the enormous capital being deployed,” Pepperstone’s Chris Weston said of the market1.
That is a sober question, not a hysterical one. In Tokyo the selling was sharp but narrow: chip-equipment makers Advantest and Tokyo Electron fell 9.1% and 5.6%, Ibiden 15.2% and Lasertec 13.8%2. The broader Topix lost a milder 1.3%, and across the Nikkei’s 225 members 123 fell while 100 rose2. Konami jumped 15.3% on its results2. Over the week, the Nikkei was still up 0.2% at that point2. Desk arithmetic: almost half the index rose on a day the headline fell 3%. That is a market sorting balance sheets, not throwing everything out.
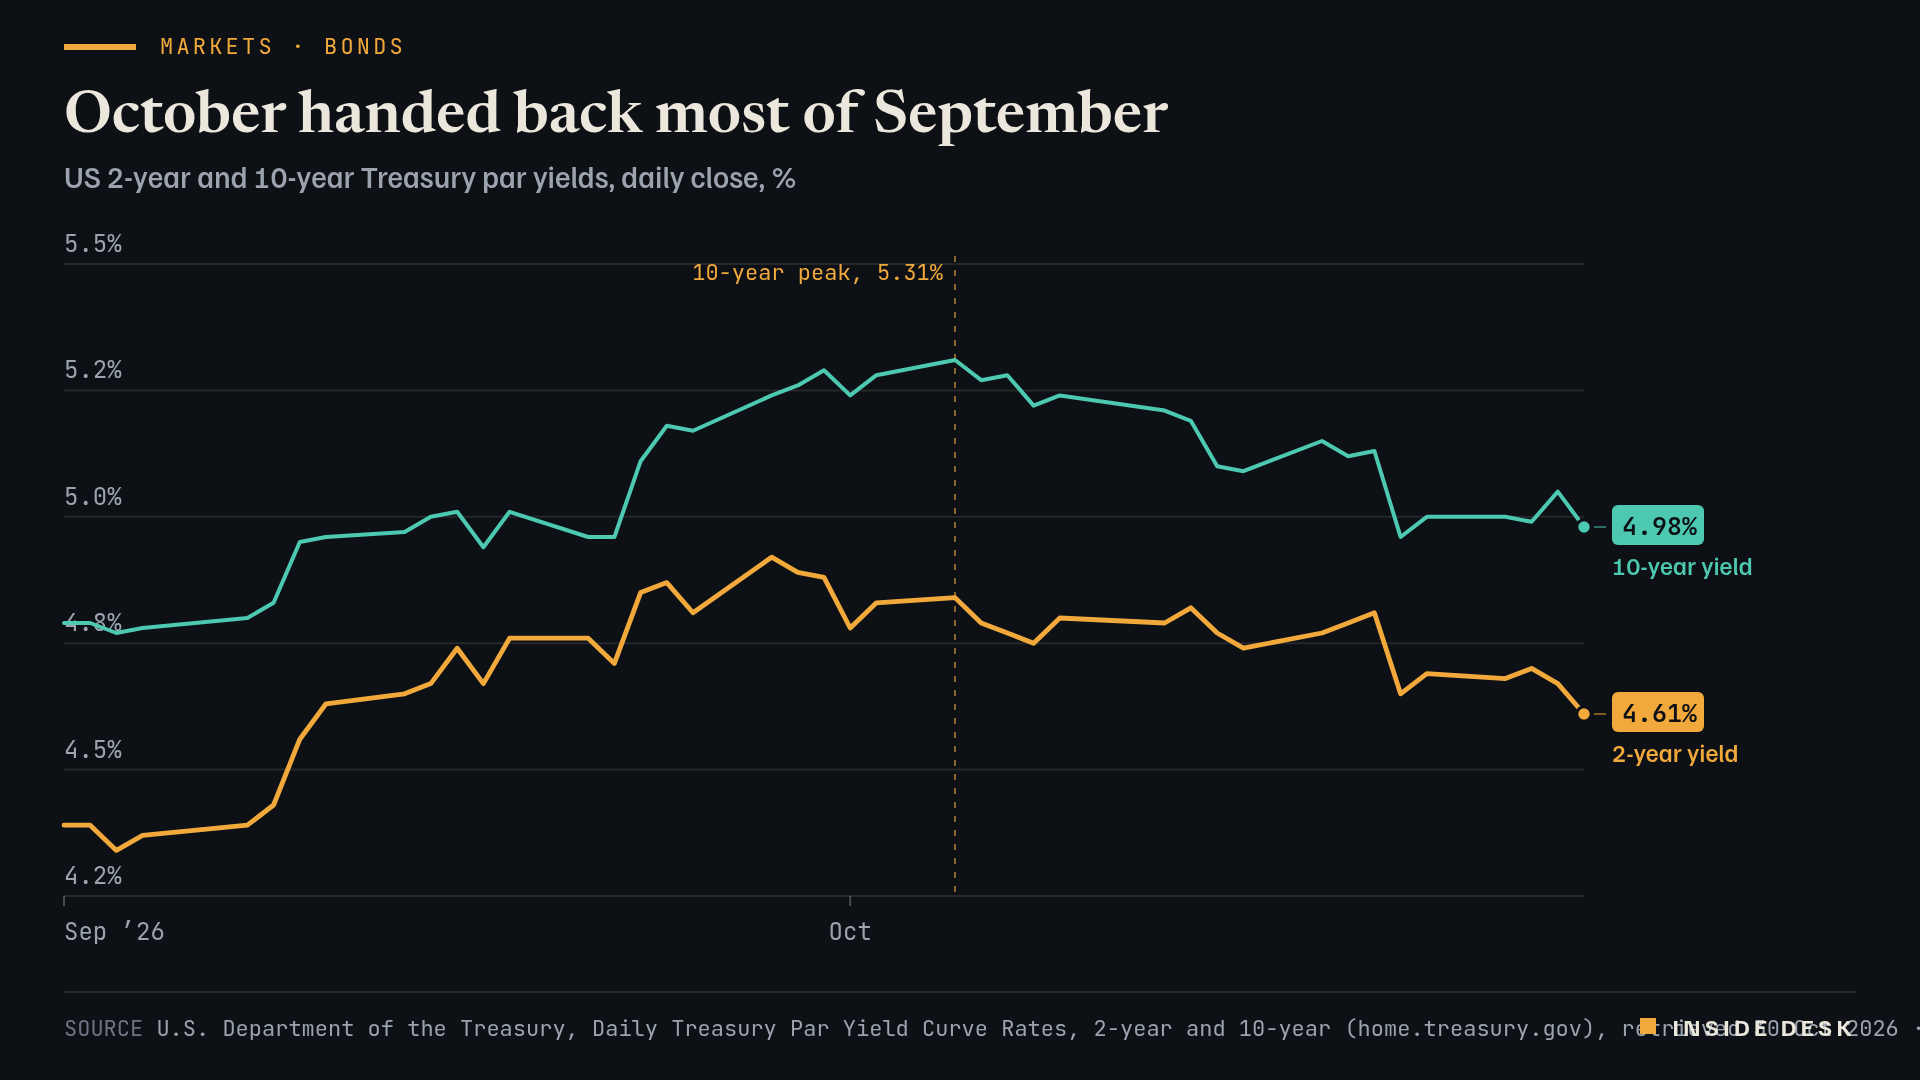
Where the money went. The cleanest receipt is the US Treasury’s own daily table. At Thursday’s close the 10-year par yield stood at 4.98% and the two-year at 4.61%4. On 30 September they were 5.29% and 4.88%4. In Tokyo trade on Friday, Reuters reports, the 10-year fell more than 7 basis points further to 4.91%, a fall of some 37 basis points through October and the largest one-month drop since December 20231. The two-year fell more than 8 basis points to 4.57%, and Fed funds futures rallied as traders dialled back some expectations of US rate rises1.
Line chart of the daily US 2-year and 10-year Treasury par yields since 1 September 2026. On 1 September the 2-year is at 4.39% and the 10-year at 4.79%. The 10-year peaks at 5.31% on 5 October; on 30 September the two stand at 4.88% and 5.29%. On Thursday 29 October 2026, the latest value, the 2-year is at 4.61% and the 10-year at 4.98%, 27 and 31 basis points below their end-September levels.
Source U.S. Department of the Treasury, Daily Treasury Par Yield Curve Rates, 2-year and 10-year (home.treasury.gov), retrieved 30 Oct 2026 · U.S. government data, public domain. Figures as reported by the named organisations; facts cited with attribution.
Data (CSV) · SVG · PNG

Latest values as a table
| Date | 2-year yield | 10-year yield |
|---|---|---|
| 2026-10-22 | 4.65 | 4.96 |
| 2026-10-23 | 4.69 | 5 |
| 2026-10-26 | 4.68 | 5 |
| 2026-10-27 | 4.7 | 4.99 |
| 2026-10-28 | 4.67 | 5.05 |
| 2026-10-29 | 4.61 | 4.98 |
Desk arithmetic, on the Treasury’s official closes: from 30 September to 29 October the 10-year fell 31 basis points and the two-year 274. The 10-year’s peak this autumn was 5.31% on 5 October4. It has now handed back most of what it gained in September.
Some of this is the Federal Reserve’s doing, not the chipmakers’. Wednesday’s hold, with no firm signal of when the next rise might come, spurred the move into bonds further, Reuters notes1. Haven currencies firmed too: the yen was up about 0.2% at 157.47 per dollar, and the Swiss franc was near a one-month high at 0.82131. Oil helped in its own way. Falling crude on optimism over Middle East peace talks supported Japanese shares, Reuters reports2.
Why this is the calm version. Falling yields mean cheaper borrowing for governments, firms and, with a lag, mortgage holders. A bond rally that comes from investors demanding proof of returns, rather than from a broken bank or a frozen market, is the financial system doing its unglamorous job: re-pricing risk and sending capital where the receipts look sturdier. Nobody had to be rescued for that to happen. Earnings season is supposed to be when slides meet ledgers. This week the ledgers won, and markets noticed.
What comes next is scheduled, not guessed. The Bank of Japan held at 1.25% by 8–1 this morning, said underlying inflation is now broadly consistent with its 2% target, and Governor Ueda speaks at 07:30 CET5. Principal Asset Management’s Howe Chung Wan told Reuters the key is how the BoJ describes “the recent global bond market volatility”1. Europe then gets its own receipts: euro-area growth at 11:00 CET and German inflation at 14:00 CET6. For you, the point is simple. The loudest number of the week was a share-price fall. The most useful one may be a yield that went down. Nothing here is investment advice.
What to watch
A sell-off tells you what people stopped wanting. The bond market tells you what they bought instead.
Sources
- Stocks slump, bonds leap as AI giants' spending spooks investors (Reuters) — Free Malaysia Today / Reuters, 30 Oct 2026, 03:55 CET.
- Japan's Nikkei slumps 3% as tech stocks tumble on AI worries (Reuters) — CNA / Reuters, 30 Oct 2026.
- Intel shares tumble after hours, hit by chip supply constraints, big cash burn (Reuters) — Euronext Live / Reuters, 30 Oct 2026, 01:05 CET.
- Daily Treasury Par Yield Curve Rates, 2026 — U.S. Department of the Treasury, 29 Oct 2026 close, retrieved 30 Oct 2026.
- BoJ declares underlying inflation at 2% target, lifts FY2027 price forecast as rates held — investingLive, 30 Oct 2026, 04:13 CET.
- TAGESVORSCHAU/Freitag, 30. Oktober (Dow Jones Newswires) — finanznachrichten.de / Dow Jones, 29 Oct 2026, 15:27 CET.
Every figure in this piece traces to a source above or to the desk’s own arithmetic on those sources, marked as such. Quotations are short and attributed. Spot an error? Write to the desk; corrections are logged on the method page.
Commentary for information only. Not investment, legal, tax, medical or political advice. Not an offer or solicitation. Analysis may be incomplete or wrong. Charts show published public data, not a trading feed; binding numbers live with the institutions that publish them.